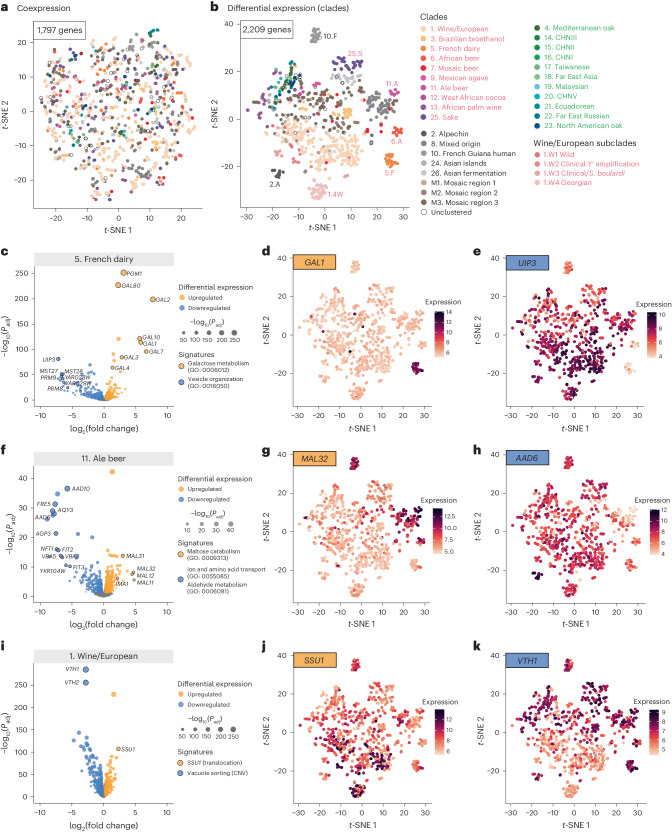
Fig. 4. Subpopulation-specific differential gene expression.
a,b, Isolate-level clustering using t-SNE based on the expression of 1,797 coexpressed genes (a) and 2,209 DEGs (b). Isolates belonging to each annotated subpopulation are color-coded. c–k, Examples of subpopulation-specific domestication signatures. Three examples are shown. c, 5. French dairy. d, 5. French dairy GAL1. e, 5. French dairy UIP3. f, 11. Ale beer. g, 11. Ale beer MAL32. h, 11. Ale beer AAD6. i, 1. Wine/European. j, 1. Wine/European SSU1. k, 1. Wine/European VTH1. In c,f,i, the volcano plots show upregulated (orange) and downregulated (blue) genes and biological processes, with the x axis showing the log2 fold change when the subpopulation was compared with the rest of the isolates, and the y axis showing the Benjamini–Hochberg-adjusted −log10Padj. The dot sizes were scaled according to the FDR. The variance-stabilized expression levels for specific upregulated (d,g,j) and downregulated (e,h,k) genes were overlapped over the t-SNE plot, with expression levels scaled as different color intensities. The colored scales are shown on the side of the plots.

