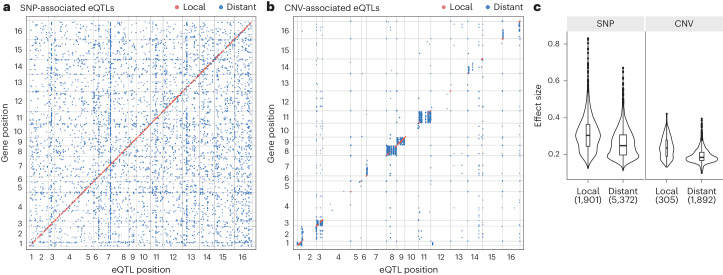
Fig. 6. GWAS-identified SNPs and CNVs with their associated eQTLs.
a, Locations of local and distant SNP-associated eQTLs along the genome. SNP variants associated with an expression trait are on the x axis; genes are shown on the y axis. Local eQTLs are shown in red and distant eQTLs in blue. b, Locations of local and distant CNV-associated eQTLs. Local eQTLs correspond to associations between the CNV and the expression trait of the same gene and are shown in red. Distant eQTLs are shown in solid blue. c, Comparison of the absolute effect sizes for local and distant eQTLs for SNP-associated and CNV-associated eQTLs. P values were determined using a two-sided Wilcoxon rank-sum test. Sample sizes are shown on the plots. The center of the box plots corresponds to the median; the upper and lower bounds correspond to the third and first quartiles. The whiskers extend to the upper and lower bounds 1.5 times the IQR (Supplementary Fig. 7).

