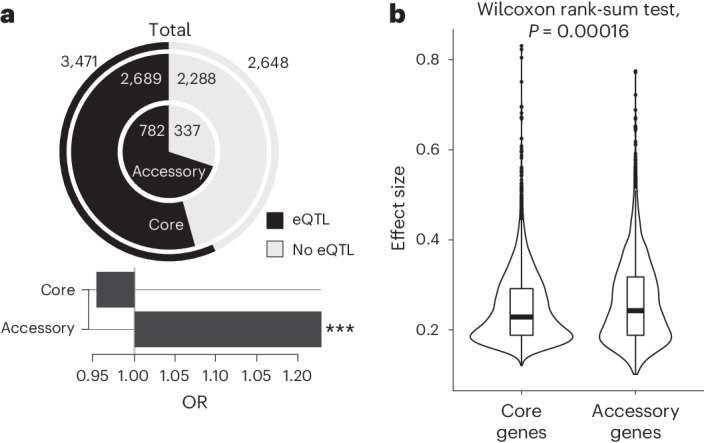
Fig. 7. Accessory genes show proportionally more eQTLs with higher effect sizes.

a, Number and proportion of genes impacted by at least one eQTL for accessory genes (inner ring), core genes (middle ring) and the combined set (outer ring). Fold enrichment for core and accessory genes on the proportion of genes impacted compared with the combined set are presented as bars (OR). Significant enrichment based on a two-sided Fisher’s test is indicated by the three asterisks (OR = 1.33, two-sided Fisher’s test, P = 0.0002676). b, Comparison of the absolute effect size for eQTLs associated with accessory or core gene expression traits. P values were determined using a two-sided Wilcoxon rank-sum test. Sample sizes are shown in the plots. The center of the box plots corresponds to the median; the upper and lower bounds correspond to the third and first quartiles. The whiskers correspond to the upper and lower bounds 1.5× the IQR. n = 3,378 for associations with accessory genes and n = 6,092 for associations with core genes (see also Supplementary Fig. 11).
