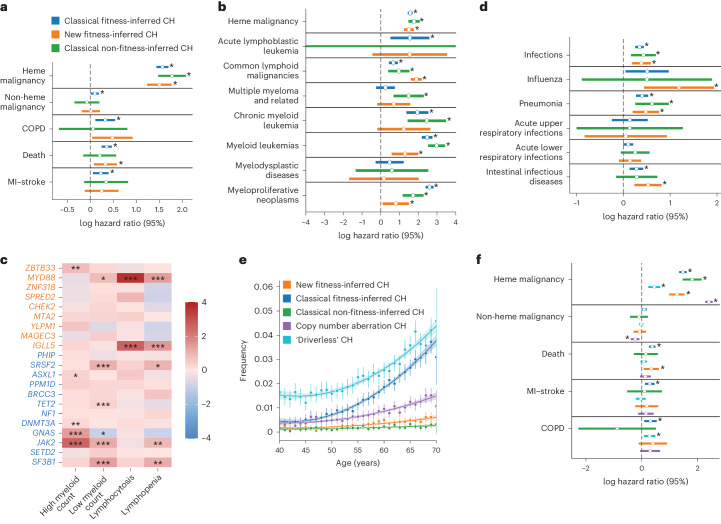
Fig. 3. Clinical outcome associations with new drivers of CH.
a,b,d, Cox-proportional HRs for a range of poor health outcomes against CH categories with CIs of log(HR) plotted. N = 200,618 individuals. Different categories of poor health outcomes are shown in a, hematological malignancies are shown in b, and infections are shown in d. *P < 0.05. Heme, hematological; COPD, chronic obstructive pulmonary disease; MI, myocardial infarct. c, Complete blood count associations of commonly mutated fitness-inferred driver genes. The stars are based on the FDR-adjusted P values from logistic regression (*P value >0.01 to <0.05, **P value >0.001 to <0.01, ***P value <0.001). e, The incidence of ‘driverless’ CH and autosomal mosaic copy number variants with age alongside other CH categories. The error bars represent the 2× standard error of the mean incidence. The smoothed line represents a second-degree polynomial fit of the actual data, and the shading represents the CI. N = 200,618 individuals. f, log(HR) with the 95% CI plotted for different categories of CH across poor health outcomes. N = 200,618 individuals. The orange shading refers to new fitness-inferred genes of CH, classical fitness-inferred genes of CH are shown in dark blue, classical non-fitness-inferred CH genes are shown in green, CH clones with copy number aberrations on autosomes are shown in purple, and CH clones without detectable candidate driver mutations are shown in light blue.

