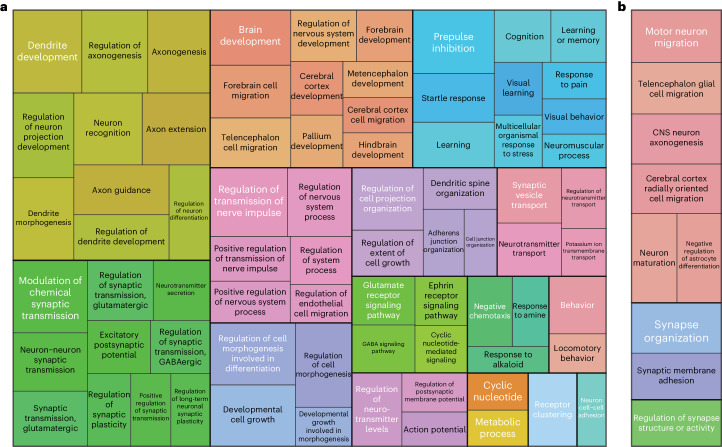
Fig. 1. Pathway enrichment analysis.
a,b, Treemaps of significantly enriched (FDR < 0.05, one-sample one-sided Z-test (DEPICT) or one-sided t-test (MAGMA)) pathways. Respective GO terms were clustered based on their semantic similarity (method: Wang, GOSemSim as implemented in the rrvgo package version 1.2.0) using results from DEPICT (a) and results from MAGMA (b). Terms are presented in rectangles. Coloring indicates the membership of a term in a specific cluster. In addition, each cluster is visualized by thick border lines. The size of each rectangle corresponds to the significance of the enrichment. The most significantly enriched term in each cluster was selected as the representative term and is displayed in white font.

