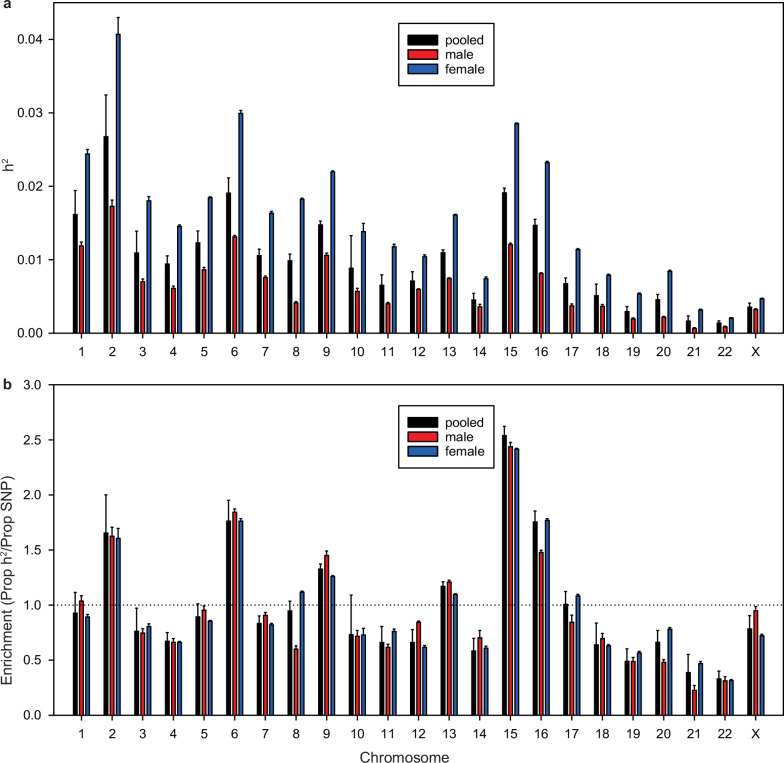
Extended Data Fig. 5. Per chromosome heritability estimation based on the EU-RLS-GENE dataset.
Heritability estimates for each chromosome. a, Overall heritability of SNPs on each chromosome. The height of the bar represents the point estimate of the heritability, and the error bars indicate the standard error of this point estimate. b, Enrichment of heritability, which is defined as the proportion of SNP-heritability divided by the proportion of SNPs in each chromosome. The height of the bar represents the point estimate of the enrichment of heritability, and the error bars indicate the standard error of this point estimate.

