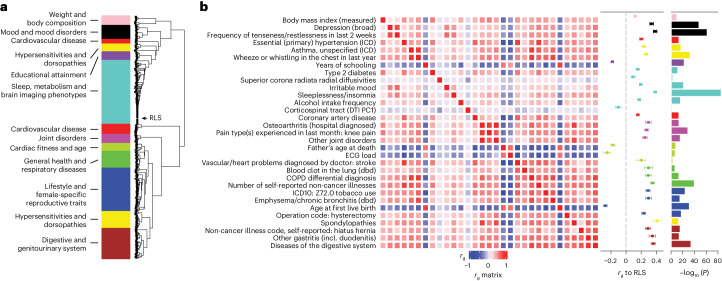
Fig. 3. Genetic correlation analysis.
a, Hierarchical clustering by a weighted correlation matrix analysis with the WGCNA package identified 11 modules. These were named with umbrella terms reflecting the type of traits contained in the respective module. b, Between-trait correlation matrix and genetic correlation with RLS for traits reflecting submodules identified in the 11 modules by consensus manual inspection of clusters. These traits were taken forward to MR analysis. The correlation matrix (rg matrix) indicates genetic correlation between the individual traits. Genetic correlation of each trait with RLS is indicated in the second column (rg to RLS); the significance of this correlation is reported in the third column (−log10 (P value), one-sample two-sided Z-test). COPD, chronic obstructive pulmonary disease; DTI PC1, diffusion tensor imaging principal component 1; ECG, electrocardiogram; dbd, diagnosed by doctor; ICD, ICD-10 coded hospital inpatient diagnosis; incl., including.

