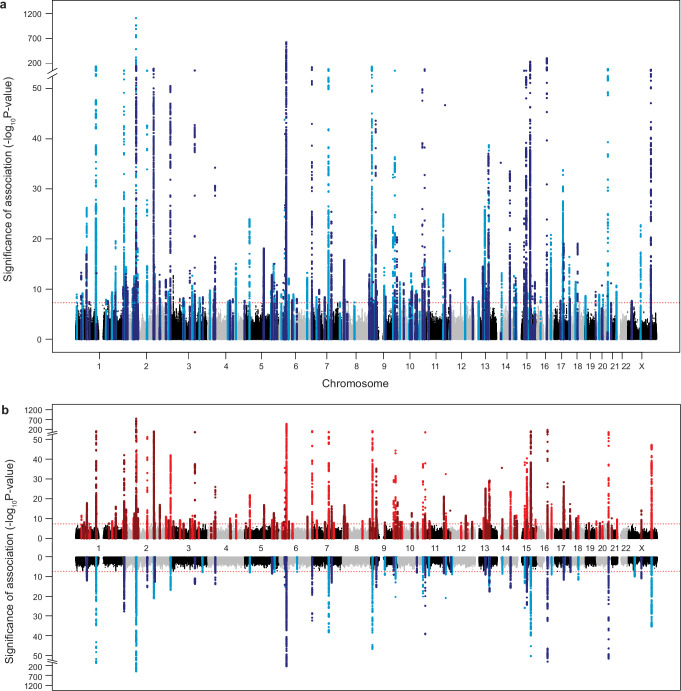
Extended Data Fig. 3. Manhattan and Miami plots of discovery stage meta-analyses.
a, Results of the pooled discovery meta-analysis. b, Results of the sex-specific discovery meta-analyses. Female-only results are depicted in red in the upper section of the Miami plot, male-only results are depicted in blue in lower section of the Miami plot. The x-axis shows chromosome and base pair positions of the tested variants. The y-axis shows significance as −log10 of the two-sided nominal P-values of the N-GWAMA analyses. Red horizontal dashed lines indicate the Bonferroni-adjusted significant threshold of P < 5 × 10⁻⁸.

