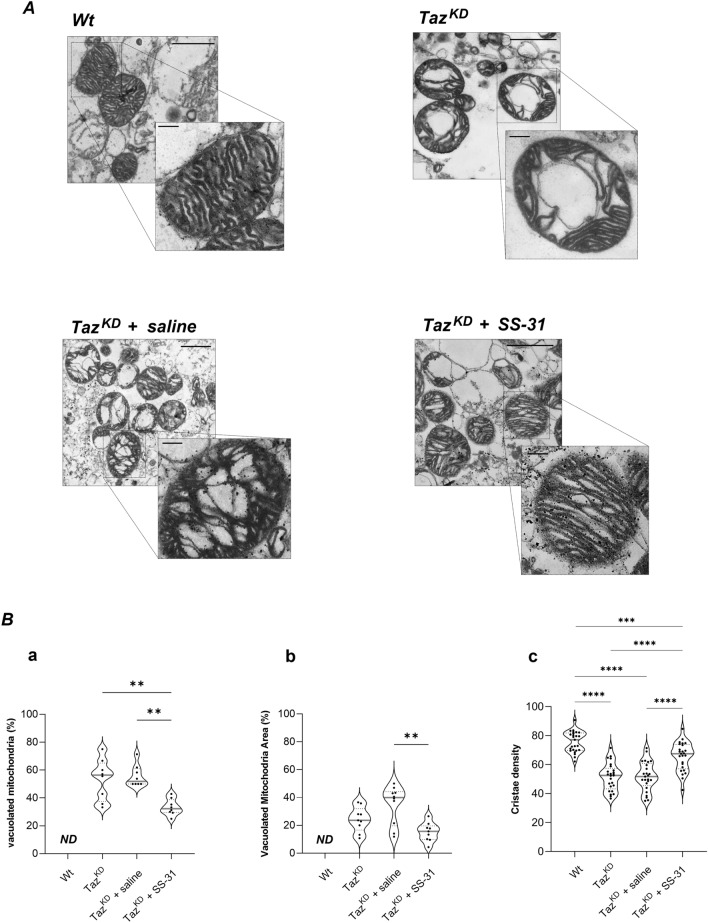
Figure 1.
Transmission Electron Microscopy (TEM) analysis of mitochondrial morphology. (A) Representative TEM images of ultra-thin sections of cardiac mitochondria isolated from Wt, TazKD, TazKD + saline and TazKD + SS-31 mice (14,000X, scale bar = 1 μm). Magnifications (56,000X, scale bar = 0.2 μm) are also shown. (B) The violin plots represent the median of values and quartiles of: (a) the number of vacuolated mitochondria expressed as percentage of total number of mitochondria, (b) the vacuoles area expressed as percentage of total mitochondrial area, and (c) the cristae density expressed as percentage of the mitochondrial area occupied by cristae, in the four groups of animals. p-value < 0.05 was considered as statistically significant (one-way ANOVA or Kruskal–Walli’s test, **p < 0.01; ***p < 0.001; ****p < 0.0001).

