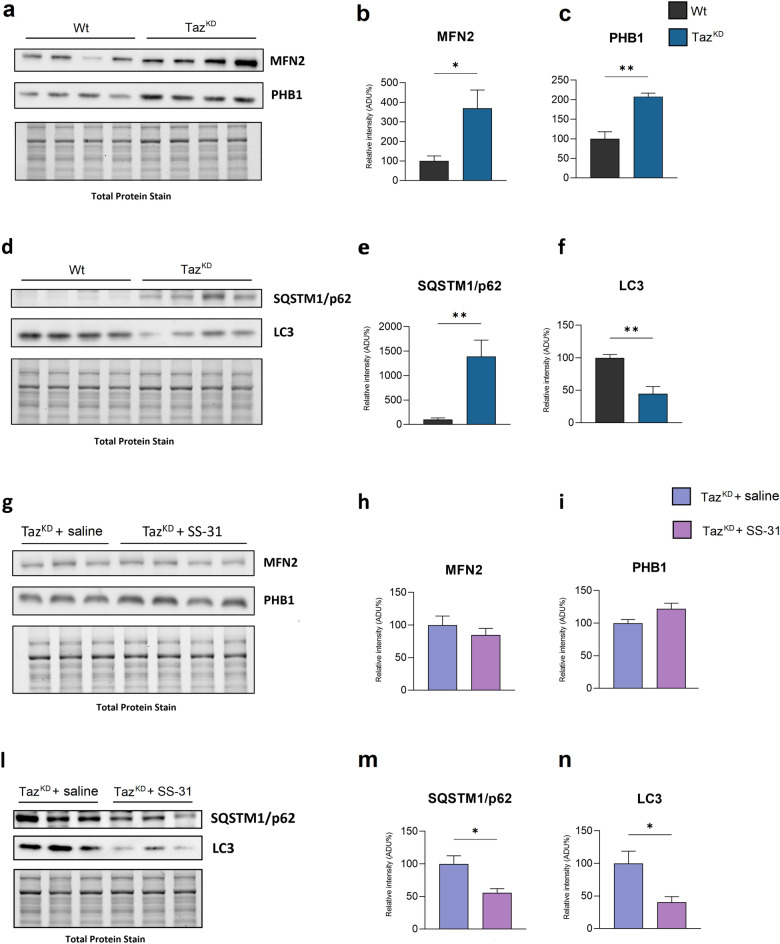
Figure 4.
Immunoblotting analysis of proteins involved in mitophagy. Western blot analysis of MFN2, PHB1, SQSTM1/p62, and LC3 protein expression in the heart of Wt and TazKD (a, d), and TazKD + saline and TazKD + SS-31 mice (g, l). The histograms show quantification of the protein expression levels MFN2 (b,h), PHB1 (c,i), SQSTM1/p62 (e, m) and LC3-II (f, n), in cardiac mitochondria from the four groups of animals, as indicated. Data are presented as means + SEM; n = 3–4 mice per group. TazKD and TazKD + SS-31 data are represented as the percentage change from Wt and TazKD + SS-saline, respectively, set on 100% (Student’s t test, *p < 0.05; **p < 0.01). Original blots are presented in Supplementary Figure S3.

