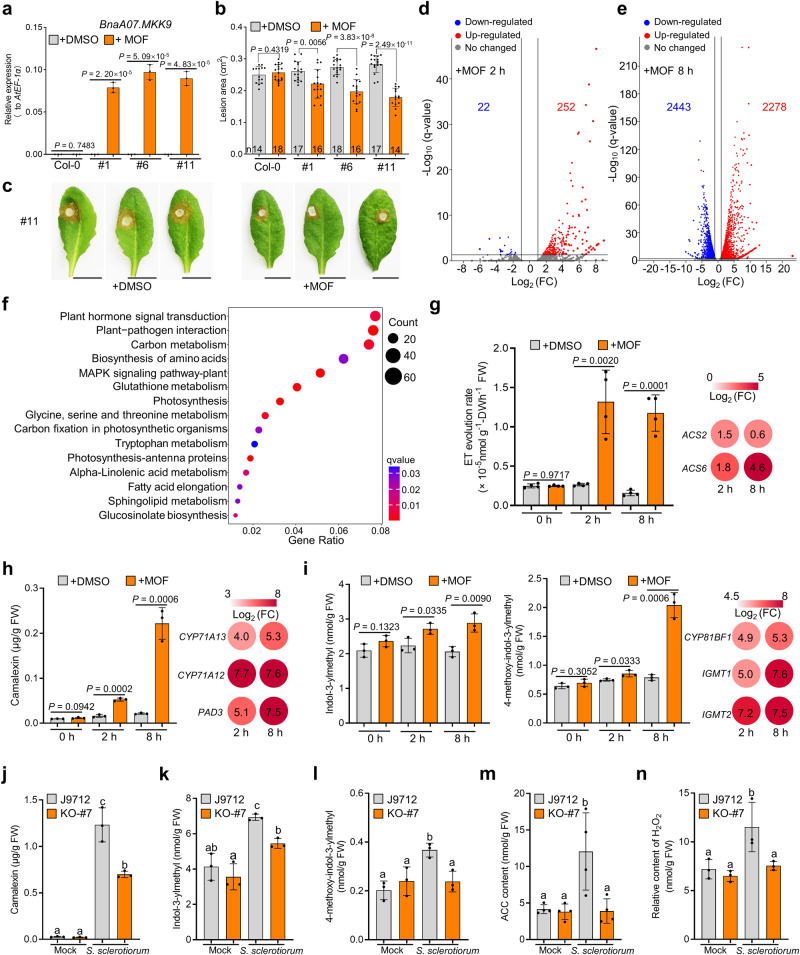
Fig. 3. Activation of BnaA07.MKK9DD induces biosynthesis of ethylene (ET), camalexin, and indole glucosinolates (IGSs).
a–c Relative expression (a), lesion areas (b), and disease symptoms (c) of Csv::BnaA07.MKK9DD transgenic Arabidopisis lines (#1, #6, and #11) and Col-0 treated with either DMSO (control) or 61.3 µM methoxyfenozide (MOF). These measurements were taken 8 h post-treatment, with AtEF-1α serving as the reference gene for expression analysis. Infected leaves were photographed and quantified at 30 h post-inoculation (hpi), scale bar: 1 cm. d, e Volcano plots showing the fold-change (FC) of differentially expressed genes (DEGs) in Csv::BnaA07.MKK9 plants at 2 h (d) and 8 h (e) after MOF versus DMSO treatment. f Kyoto Encyclopedia of Genes and Genome (KEGG) pathway analysis showing the top 15 enrichment terms among the DEGs in Fig. 3e. g–i Quantification of ethylene (ET) (g), camalexin (h), and indol-3-ylmethyl glucosinolate (I3G) and 4-methoxyindol-3-ylmethyl glucosinolate (4MI3G) (i) in Csv::BnaA07.MKK9DD plants at 0, 2, and 8 h after DMSO or MOF treatment. Changes in the expression of the genes involved in biosynthesis of ET, camalexin, and IGSs (MOF versus DMSO treatment) are shown as a heatmaps. j–n Camalexin (j), IGSs (k, l), 1-aminocyclopropane-1-carboxylic acid (ACC, m) and H2O2 (n) contents in Bnamkk9 knockout (KO)-#7 and J9712 control plants at 12 hpi with S. sclerotiorum or the mock inoculation. For (a), values represent means ± SD from three biological replicates. In (b), bars represent the mean ± SD, and n represents the number of plants. In (g–n), bars represent the mean ± SD (n = 3 biological replicates in (h–l, and n), n = 4 biological replicates in (g and m)). In (a, b) and (g–i), statistical significance was determined by a two-tailed Student’s t-test. In (j–n), different letters indicate significant differences (P < 0.05), determined with one-way analysis of variance (ANOVA) and Tukey’s honestly significant difference (HSD) test. Source data are provided as a Source Data file.

