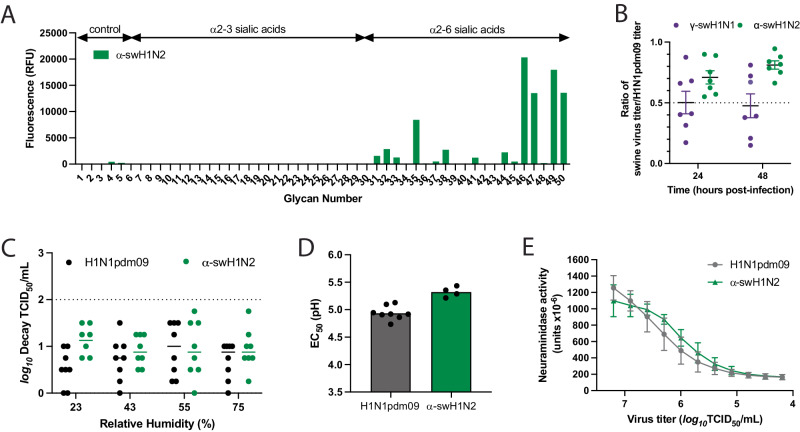
Fig. 4. In vitro characterization of swine γ-H1N1 and α-H1N2 influenza viruses.
A Binding of α-swH1N2 virus to a sialoside microarray containing glycans with α2-3 or α2-6 linked sialic acids representing avian-type and human-type influenza receptors, respectively. Bars represent the fluorescence intensity of bound α-swH1N2. Glycan structures corresponding to numbers are shown on the x-axis are found in Supplementary Table 1. Signal values are calculated from the mean intensities of 4 of 6 replicate spots with the highest and lowest signal omitted. B Replication of swine influenza virus in human bronchial epithelial (HBE) air-liquid interface cell cultures. HBE cell cultures were infected in triplicate with 103 TCID50 (tissue culture infectious dose 50) per well of H1N1pdm09, γ-swH1N1, or α-swH1N2. The apical supernatant was collected at the indicated time points and virus titers were determined on MDCK cells using TCID50 assays. A ratio of swine virus titer relative to H1N1pdm09 titer at 24 and 48 h of all HBE patient cell cultures is shown. Each dot represents an average of three technical replicates per HBE culture, and seven biological replicates from different HBE patient cultures are displayed. Data are presented as mean values +/− SD of the seven biological replicates each with three technical replicates. C Stability of α-swH1N2 influenza virus in small droplets over a range of relative humidity (RH) conditions. Ten 1 uL droplets of pooled virus from panel B were spotted into the wells of a tissue culture dish for 2 h. Decay of the virus at each RH was calculated compared to the titer of ten 1 uL droplets deposited and immediately recovered from a tissue culture dish. Log10 decay of HBE-propagated H1N1pdm09 (black) and α-swH1N2 (green) is shown and represents mean values (±SD) from eight biological replicates performed in three technical replicates. D H1N1pdm09 (gray, N = 8) and α-swH1N2 (green, N = 4) viruses were incubated in PBS solutions of different pHs for 1 h at 37 °C. Virus titers were determined by TCID50 assay and the EC50 values were plotted using regression analysis of the dose-response curve. The reported mean corresponds to at least four independent biological replicates, each performed in three technical replicates. E The NA activities of H1N1pdm09 (gray) and α-swH1N2 (green) were determined using an enzyme-linked lectin assay with fetuin as the substrate. Viruses were normalized for equal infectivity and displayed data are the mean (±SD) of three independent biological replicates performed in technical duplicates.

