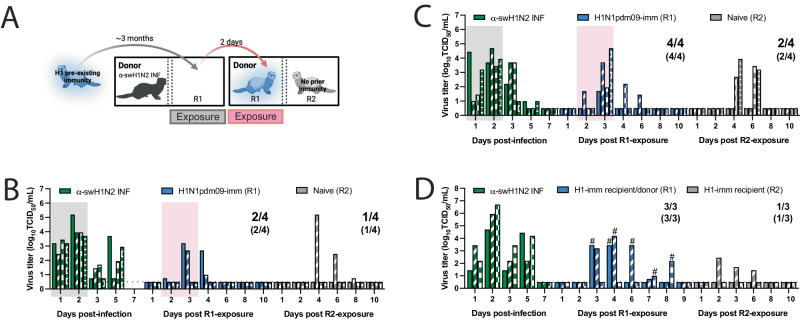
Fig. 6. Swine H1N2 virus transmission chain.
A Schematic of transmission chain experiment in B and C (image created with BioRender.com). Four ferrets were infected with H1N1pdm09 (R1) 127 days before being exposed to a donor that was infected with α-swH1N2 24 h prior. After a 2-day exposure, H1N1pdm09-imm recipients were transferred to a new transmission cage to act as the donors. The transfer of each R1 animal was done without knowledge of its infection status. A naïve recipient (R2) was immediately placed in the adjacent cage and exposed for 2 days. The transmission chain experiment was performed two independent times. Nasal secretions were collected for all animals on the indicated days post-infection or post-exposure, with each bar representing the virus titer shed by an individual animal for replicate 1 (B) and replicate 2 (C). Pairs of ferrets can be matched based on the patterns in the bars. Gray shaded boxes indicate the days upon which the α-swH1N2 infected (α-swH1N2 INF) donor was exposing the H1N1pdm09-imm recipient (R1), and the pink shaded box indicates the days upon which R1 was acting as the donor to R2. Limit of detection is denoted by a dashed line. The numbers in parentheses indicate the proportion of animals that seroconverted. D Donors were infected with α-swH1N2 24 h prior to exposing H1N1pdm09-imm recipients. Nasal washes from R1 recipients were collected and immediately tested using a rapid antigen test. Once positive for influenza virus antigen, the H1N1pdm09-imm R1 recipient was moved into a new transmission cage to act as the donor and expose an H1N1pdm09-imm R2 recipient for 2 days. # indicates the 2-day window in which each of the R1 ferret exposed the R2 recipients.

