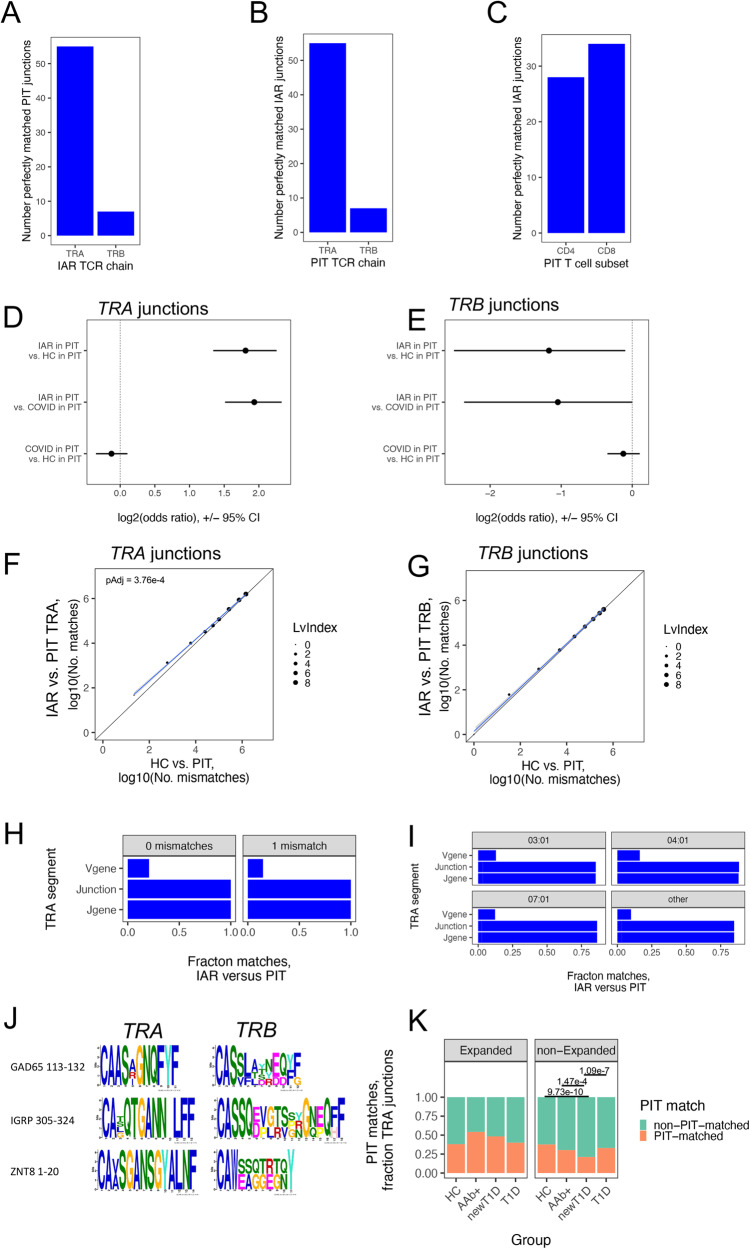
Fig. 1. IAR T-PIT TCR sequence matching.
Panels A–G utilized TCRs from Cohort1; panels H-K, TCRs from combined Cohorts 1 + 2. A) Perfectly matched IAR TRA and TRB junctions from Cohort 1 (Table 2) in PIT TCRs (n = 9,757 unique TRA and TRB junctions, Table 2). B Perfectly matched PIT TRA and TRB junctions in IAR TCRs (n = 4,310 unique TRA and TRB junctions). C Perfectly matched PIT T cell TCR junctions from CD4+ and CD8+ cells in IAR TCRs. D Perfectly PIT-matched versus non-matched TRA junctions from Cohort 1 IAR T cell TCRs (n = 55 matched and 2119 non-matched) versus TRA junctions from HC20 (185 matched and 24,968 non-matched) and COVID-19 patients20 (1341 matched and 197,412 non-matched). E As in D but using TRB junctions (n = 7 matched and 2129 unmatched). F PIT junction matching in IAR TRA junctions versus junctions from HC donors20. Dot sizes, Levenshtein index values. Diagonal line, equivalency line. Blue line, best fit line from linear modeling. The pAdj for a slope different from 1 was calculated using linear modeling and ANOVA. Gray shading, 95% confidence intervals. G As in F but using TRB junctions. H PIT matching by different TRA chain segments in combined Cohorts 1 and 2 (n = 3264 unique TRA junctions). Lv0 and Lv1, Levenshtein index values of 0 and 1 (n = 74 and 2025 unique TRA junctions, respectively). I PIT matching by TRA junction segments in combined Cohorts 1 and 2 according to HLA-DRB1 alleles in PIT donors. There were: n = 484, 153, 199, and 95 junctions from donors having 03:01, 04:01, 07:01, and other HLA-DRB1 alleles, respectively. J Junction sharing by TCRs with PIT-matched TRA junctions. One TCR in each group recognized13 the indicated autoantigen epitope. K Total TRA chains (Table 2) in expanded (n = 1000) and non-expanded (n = 2907) cells from combined Cohorts 1 and 2 were tested for differences in PIT-matched and non-PIT-matched junctions from HC, Aab + , newT1D, and T1D donors using two-sided Fisher’s exact tests.

