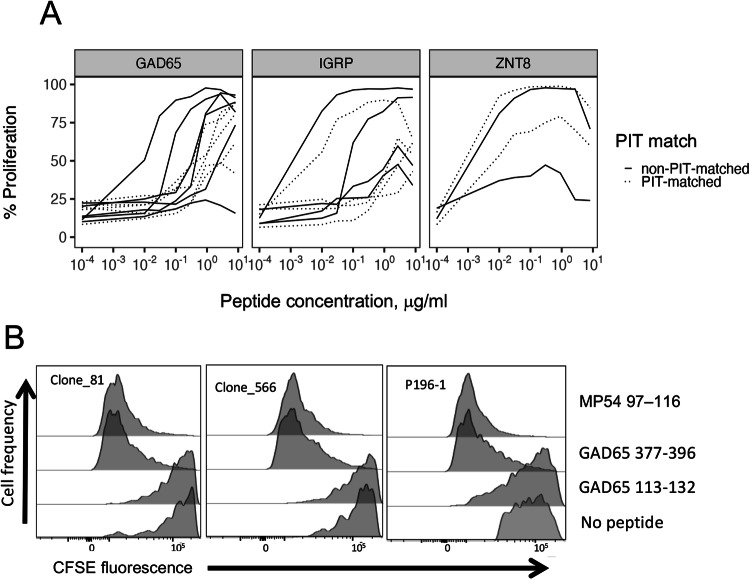
Fig. 4. Functional properties of selected PIT-matching and non-matching TRA chains of known specificity.
A Dose response curves for TCRs recognizing GAD65 (n = 11), IGRP (n = 8) and ZNT8 (n = 4) epitopes12. Curves represent single values for each point. Curves for multiple epitopes per target antigen were pooled to increase power; examination of curves for individual epitopes yielded conclusions consistent with the pooled data. B Cross-reactivity of TCRs with PIT-matching TRA junctions (Table 5) for autoimmune (GAD65) and viral (influenza M protein) epitopes in a CFSE proliferation assay.

