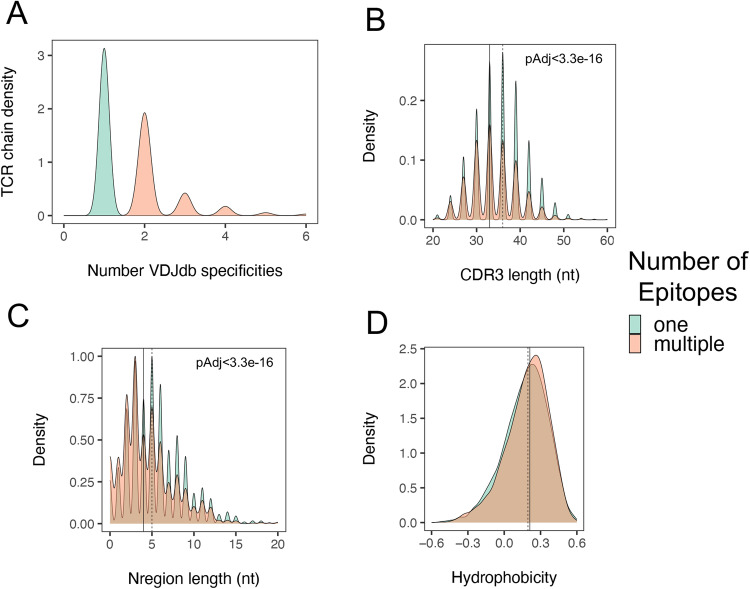
Fig. 5. TRA junctions from cross-reactive TCRs in the VDJdb database shared junction sequence features with PIT-matched TRA junctions.
A Density of TRA chains from TCRs with one versus multiple specificities in VDJdb. There were n = 17,826 unique TRA chains from TCRs with single specificity and n = 1664 with multiple specificities. B Distribution of TRA CDR3 nt lengths from TCRs with one versus multiple specificities; C Distribution of TRA N region nt lengths. D Distribution of TRA junction AA hydrophobicity. Solid vertical lines, median values from TRA chains from multi-specific TCRs; dashed vertical lines, median values from TCRs with single reported specificities. Significance of differences in distributions were assessed using two-sided Kolmogorov-Smirnov tests.

