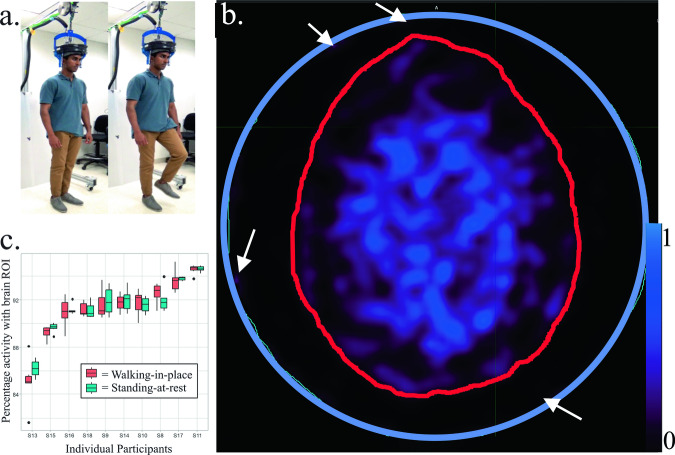
Fig. 1. AMPET set-up and motion artifact analyses.
The AMPET helmet set up and motion artifact analyses (n = 10). a Set-up showing a model (co-author N.S.) demonstrating the task of standing-at-rest and then walking-in-place. b Example of Motion Tolerance ROI’s drawn in an axial brain image by tracing skull (red outline) versus imager inner edge marking the FOV (blue circle). White arrows point out a few small regions of activity outside the brain that reflect some form of artifact (on average 5.4–14.9% of total, depending on anatomy of participant). The stability of the ratio of activity inside versus outside the brain was used in the motion variance-related measurement differences in walking-in-place versus standing-at-rest, with blues and purples indicating activity. Scale bar indicates relative uptake signal intensity. c Boxplot of ROI average amplitude during active walking-in-place versus standing-at-rest periods. The upper and lower limits of the box are the lower and upper quartiles, the ends the whiskers are maximum and minimum of data. Dots indicate value of the individual participant measurements included in the averages. If the imager moved significantly relative to the brain, walking-in-place versus standing-at-rest would show an altered ratio, due to movement in or out of the axial imaging plane. The results show no significant differences as a group or individually in any participant tested. Source data can be found in Supplementary Data 1.

