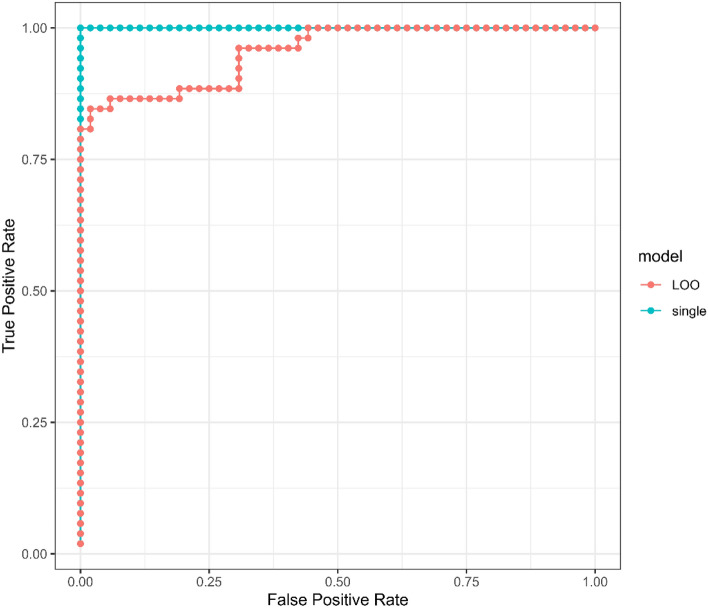
Figure 2.
Receiver-operator-characteristic (ROC) curves for LIFE and CON group discriminators trained on the entire metabolomics dataset. The blue curve is derived from category scores obtained from a single model optimized on all 104 samples, while the red curve depicts category scores obtained for each of 104 samples using 104 separate models optimized on 103 samples (leave-one-out cross-validation, LOO-CV). The area under the curves (AUC) for the single model and LOO models were 1.0 and 0.96, respectively, with p values of 7.7e−19 and 5.6e−16.

