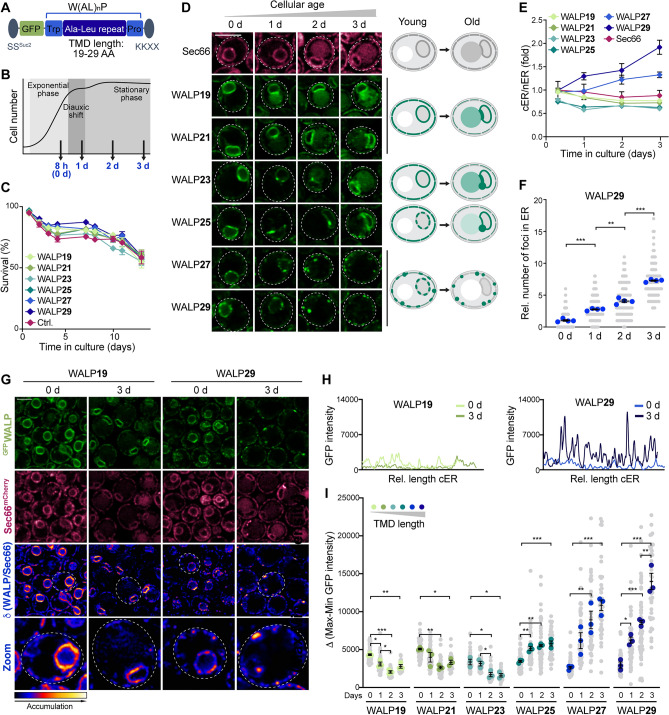
Figure 1.
Age-dependent remodeling of the ER membrane. (A) Schematic of the ER membrane thickness reporters (GFPWALPs) based on a transmembrane domain (TMD) of varying length (19–29 AA), achieved by different numbers of Ala-Leu dipeptides. The SSSuc2 signal sequence facilitates ER membrane targeting and the KKXX signal retains the reporters within the ER. (B) Schematic illustrating the time points analyzed. Cells were assessed during exponential growth (0 day/8 h), at the end of the diauxic shift (1 day) and in early/late stationary phase (2 day and 3 day). (C) Flow cytometric quantification of cell death during chronological aging via propidium iodide staining of wild type (WT) and cells endogenously expressing GFPWALPs. Mean ± s.e.m.; n = 4. (D) Micrographs of cells expressing Sec66mCherry and indicated GFPWALPs. Scale bar: 3 μm. Schematics of age-dependent redistribution of the WALP sensors and vacuolar GFP accumulation. (E) Ratio of the mean GFP intensities of the cortical (cER) and nuclear ER (nER) of cells expressing GFPWALPs, quantified from confocal micrographs and depicted as fold of the WALP21 cER/nER ratio in young cells (0 d). Mean ± s.e.m.; n = 5, with > 50 cells per n. (F) WALP29 foci frequency, showing individual cells from 4 independent experiments (gray dots), the average for each experiment (blue dots; 17–40 cells per n), and the grand mean ± s.e.m. (lines) of the individual experiments (n = 4). (G) Micrographs of young and old cells expressing Sec66mCherry and WALP19 or WALP29. The ratio of GFPWALP to Sec66mCherry visualizes the ER membrane regions with specific GFPWALP accumulation. Scale bar: 3 μm. (H) GFP fluorescence intensity profiles of the cER of a representative cell expressing WALP19 or WALP29 at day 0 and day 3. (I) GFP intensity profiles as shown in (H) were used to calculate the average difference between the minimal and maximal GFP intensity of the cER per cell. Individual cells from 3 independent experiments (gray dots), the average for each experiment (colored dots; 10–30 cells per n), and the grand mean ± s.e.m. (lines) of the individual experiments (n = 3) are shown. *p ≤ 0.05, **p ≤ 0.01, ***p ≤ 0.001.

