Figure 3.
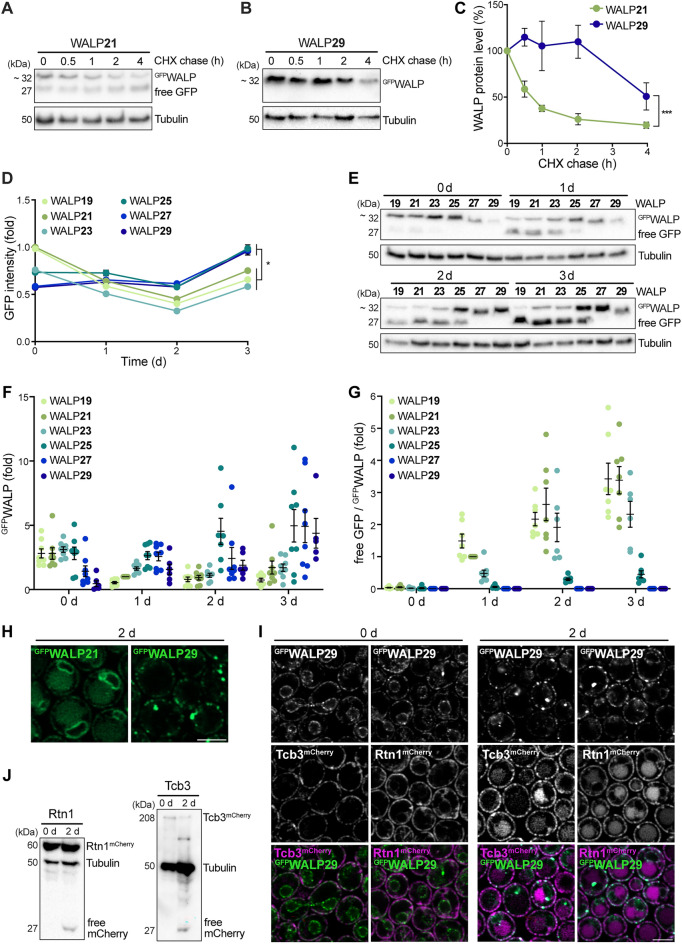
Partitioning into raft-like microdomains increases protein stability and prevents autophagic removal. (A–C) Immunoblot analysis of total protein extracts from WT cells expressing GFPWALP21 or GFPWALP29 collected at indicated time points. After 8 h of growth, cells were treated with cycloheximide (CHX) to stop translation and the turnover of GFPWALP was determined. Representative blots (A, B) and corresponding densitometric quantification of the GFPWALP protein levels (C) are shown. Blots were probed with antibodies directed against GFP and tubulin as loading control. The GFPWALP protein levels are shown as percentage of protein level before CHX treatment (0 h); Data represent mean ± s.e.m.; n = 5. (D) Flow cytometric quantification of total cellular GFP fluorescence intensity of WT cells expressing one of the six GFPWALPs at indicated time points. Dead cells were excluded from the analysis via counterstaining with propidium iodide. GFP intensity is shown as fold of WALP21 at day 0; Data represent mean ± s.e.m.; n = 6. (E–G) Immunoblot analysis of total protein extracts from WT cells expressing one of the six GFPWALPs collected at indicated time points. Blots were probed with antibodies directed against GFP and tubulin as loading control. A representative blot (E) and corresponding densitometric quantification of GFPWALP protein levels normalized to tubulin (F) as well as of the ratio of free GFP to GFPWALP, indicative of autophagic turnover (G), are shown. Values have been normalized to the respective values of GFPWALP21 at day 1. Dot plots with mean ± s.e.m.; n = 8. (H) Micrographs of cells expressing GFPWALP21 or GFPWALP29 at day 2 of chronological aging. Scale bar: 3 μm. (I) Micrographs of cells expressing GFPWALP29 and either Tcb3mCherry or Rtn1mCherry at indicated days during aging. Scale bar: 3 μm. (J) Immunoblot analysis of total protein extracts from cells described in (I). Blots were probed with antibodies directed against mCherry and tubulin as loading control. *p ≤ 0.05, ***p ≤ 0.001.

