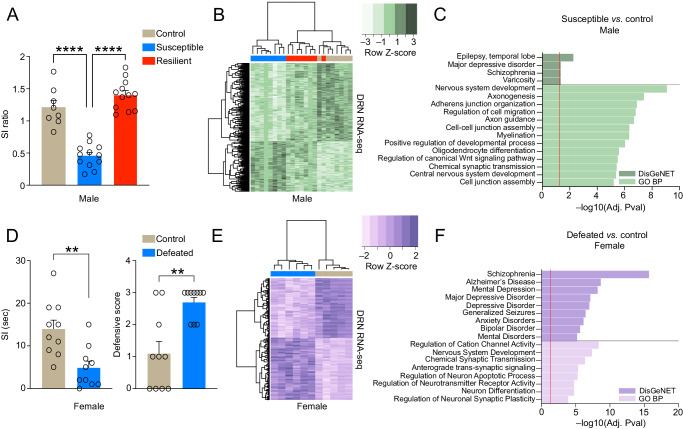
Fig. 1. Chronic social stress in both male and female mice results in altered gene expression in DRN.
A SI ratio of control vs. stress-susceptible vs. stress-resilient male mice (n = 8 for controls, 12 for susceptible and 12 for resilient groups). One-way ANOVA significant main effects observed (p < 0.0001, F2,29 = 53.44). Tukey’s MC test: control vs. susceptible mice (p < 0.0001) and susceptible vs. resilient mice (p < 0.0001). B Clustering of control, susceptible and resilient groups for 1502 differentially expressed (DE) genes (susceptible vs. control; n = 7–8/group, FDR < 0.05). C Pathway enrichment (FDR < 0.05; Benjamini–Hochberg) for the PCGs differentially expressed (FDR < 0.1) in susceptible vs. control males. Dashed line indicates significance via adjusted p value. DLeft SI time of control vs. socially defeated female mice (n = 10/group). Student’s two-tailed t tests: defeated vs. control mice (p = 0.0021, t18 = 3.582). DRight Defensive scores for control vs. socially defeated female mice. Mann-Whitney test (unpaired): defeated vs. control mice (p = 0.0034, U = 14.50). E Clustering of defeated and control groups for 234 DE genes (defeat vs. control; n = 5–6/group, FDR < 0.05). F Pathway enrichment (FDR < 0.05; Benjamini–Hochberg) for PCGs differentially expressed in defeat vs. control females (at FDR < 0.1). Dashed line indicates significance via adjusted p value. For bar graphs, data presented as mean ± SEM. Source data are provided as a Source Data file.

