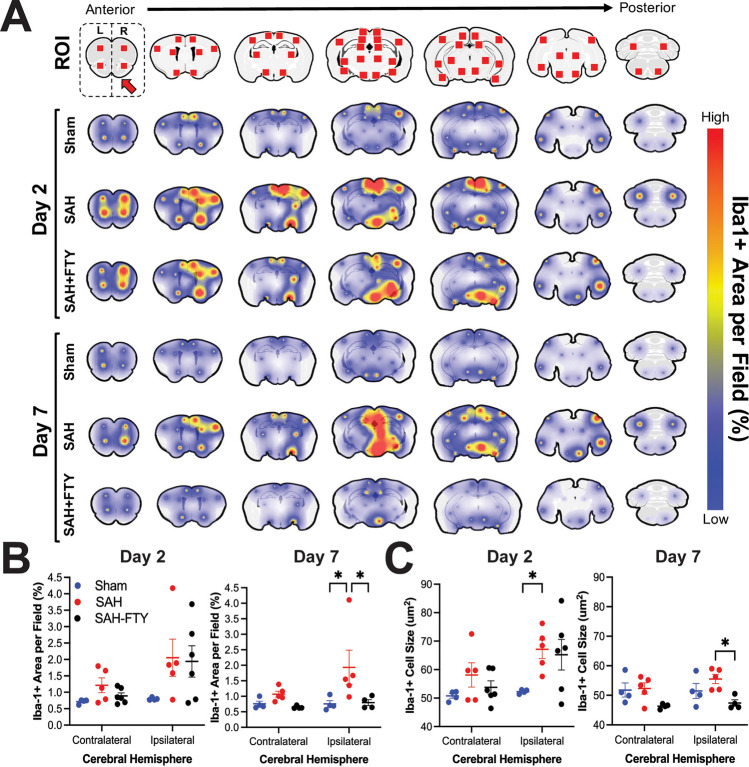
Figure 7.
Spatiotemporal mapping reveals increased microglia and cell size that are attenuated by FTY treatment. 64 regions of interest (ROIs) were selected spanning the entire rostral-caudal axis. Iba-1+ area per field within each ROI was then quantified and mapped onto the rodent brain in sham, untreated SAH, and SAH-FTY animals at 2- and 7-days following surgery. (A) There was a clear association between location of bleeding and Iba-1+ cell responses, although several distant sites also showed increased signal, typically ipsilateral to arterial perforation. At 2 days, Iba-1+ was increased in both untreated SAH and SAH-FTY animals compared to shams. At 7 days, SAH-FTY animals displayed a drastic reduction in Iba-1+ compared to untreated SAH animals. (B) Increased Iba-1+ was observed in the ipsilateral hemisphere of SAH animals, most pronounced on day 7, where Iba-1+ was significantly increased in SAH animals compared to shams and attenuated by FTY. Day 2: Two-way ANOVA with main effects of group (p = 0.032), Šídák’s multiple comparisons test for ipsilateral hemisphere: sham vs. SAH p = 0.072, SAH vs. SAH-FTY p = 0.993, for contralateral hemisphere: sham vs. SAH: p = 0.725, SAH vs. SAH-FTY p = 0.875. Day 7: Two-way ANOVA with main effects of group (p = 0.014), Šídák’s multiple comparisons test for ipsilateral hemisphere: sham vs. SAH p = 0.020, SAH vs. SAH-FTY p = 0.025, for contralateral hemisphere: sham vs. SAH: p = 0.821, SAH vs. SAH-FTY p = 0.645). (C) Similar results were observed with Iba-1+ cell size, where increased cell size was observed at 2 days in SAH animals compared to shams, but by day 7 SAH-FTY animals had reduced Iba-1+ cell size compared to untreated SAH animals. Day 2: Two-way ANOVA with main effects of group (p = 0.026) and hemisphere (p = 0.024), Šídák’s multiple comparisons test for ipsilateral hemisphere: sham vs. SAH p = 0.037, SAH vs. SAH-FTY p = 0.974, for contralateral hemisphere: sham vs. SAH: p = 0.476, SAH vs. SAH-FTY p = 0.770. Day 7: Two-way ANOVA with main effects of group (p = 0.003), Šídák’s multiple comparisons test for ipsilateral hemisphere: sham vs. SAH p = 0.330, SAH vs. SAH-FTY p = 0.013, for contralateral hemisphere: sham vs. SAH: p = 0.996, SAH vs. SAH-FTY p = 0.081. n = 4–6 animals per group. Data shown as mean ± standard error.

