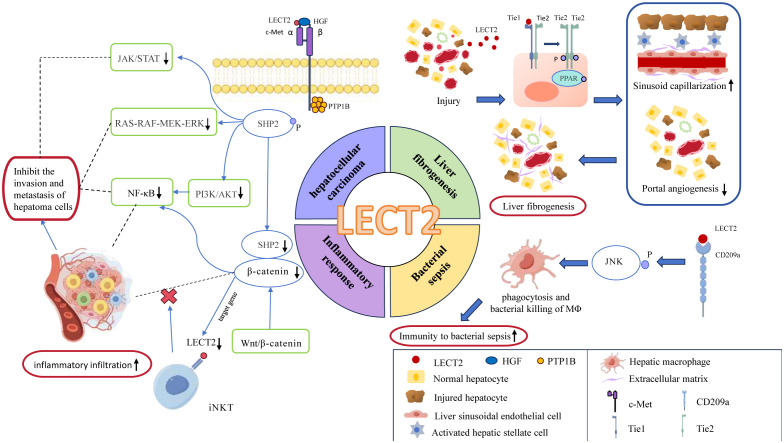
Figure 9.
the mechanism diagram of LECT2’s involvement in the regulation of related diseases, including hepatocellular carcinoma, liver fibrogenesis, bacterial sepsis, inflammatory response. In this figure, blue ovals represent enzymes or proteins; red rounded rectangles represent effects; green rounded rectangles represent the signaling pathways; Tie1, Tie2: as tyrosine kinase receptors, they are subtypes of Tie; PPAR, peroxisome proliferators-activated receptors; JNK, c-Jun N-terminal kinase; c-Met, cellular-mesenchymal epithelial transition factor; HGF, hepatocyte growth factor; PTP1B, Protein Tyrosine Phosphatase-1B; SHP2, Src homology 2 domain-containing protein tyrosine phosphatase.

