Figure 2.
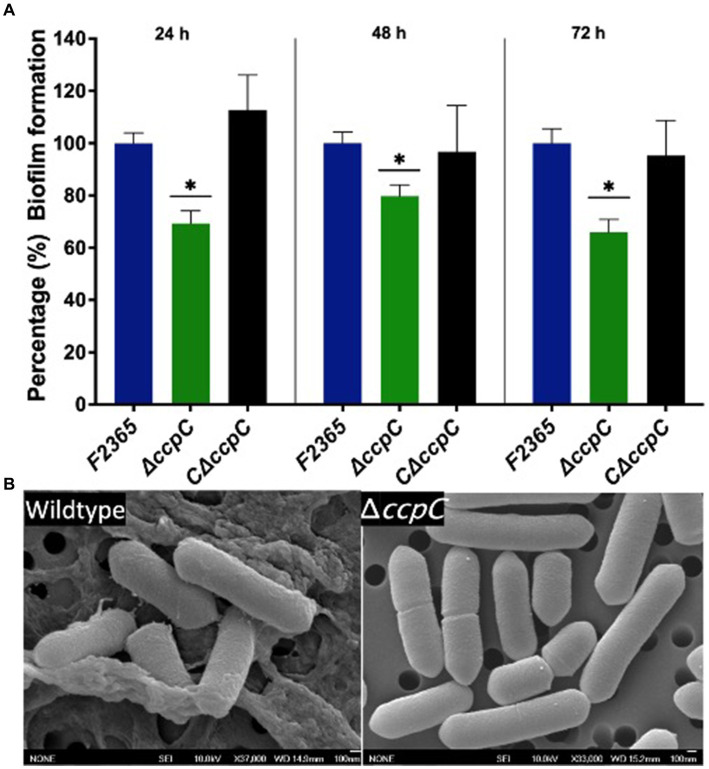
The ΔccpC strain exhibited a reduction in biofilm formation relative to the wildtype F2365 strain. (A) Biofilm formation was quantified by measuring the absorbance at 538 nm to detect biofilm crystal violet staining after 24, 48, and 72 h incubations in polystyrene plates. Data represent mean of six replicates ± standard error (SEM). (B) Scanning electron microscopy results showing the presence of biofilm formation in wildtype and the absence of biofilm formation for the ΔccpC strain. Data of wildtype F2365 and ΔccpC was compared with Student’s t-tests. * Shows significant differences only in the ∆ccpC mutant (p < 0.05).

