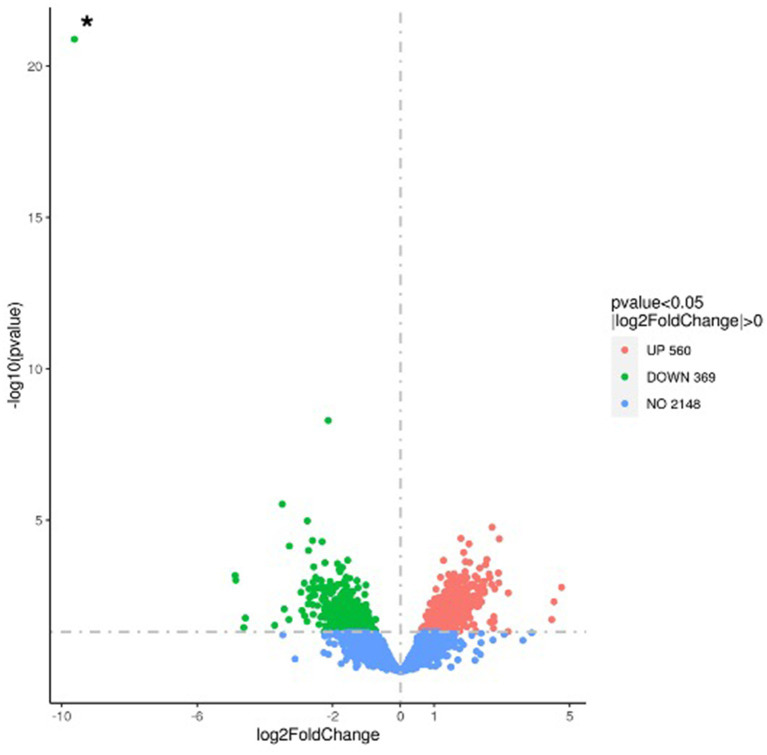
Figure 6.
Volcano plot highlighting the differentially expressed genes in the ΔccpC compared to L. monocytogenes wildtype F2365 strain following oxidative stress induced by H2O2. The fold change in expression of each gene is plotted against the significant level (p-value) of the corresponding gene expression change. Upregulated genes are plotted in red, and downregulated genes are in green. The asterisk (*) indicates the ccpC gene, shown here as the most highly downregulated gene in this comparative analysis.

