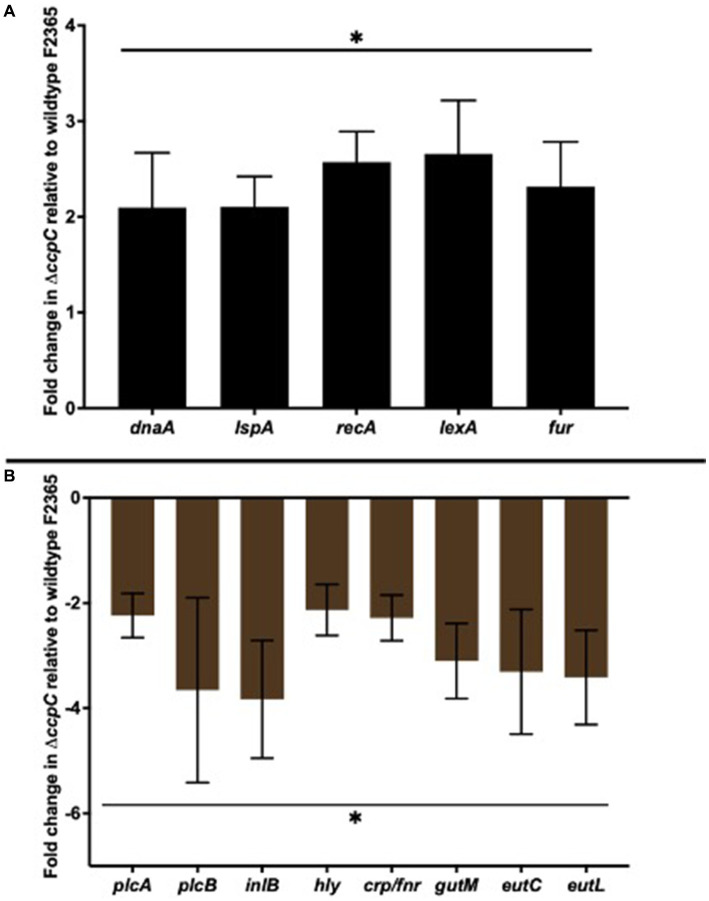
Figure 7.
RT-qPCR analyses of select upregulated (A) and downregulated (B) differentially expressed genes. The selected five upregulated DEGs (dnaA, ispA, recA, lexA, and fuR) and eight downregulated DEGs (plcA, plcB, inlB, hly, crp/fnr, gutM, and eutL) showed expression profiles consistent with the transcriptomic sequencing results. Bars indicate the SEM of the mean of six biological replicates. The data were compared with Student’s t-tests. Asterisks (*) indicate significant differences, p < 0.05.

