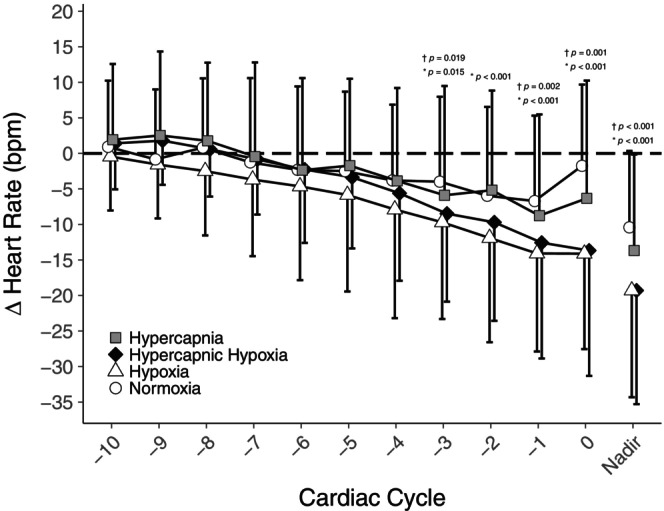
FIGURE 3.

Mean (± SD) change in heart rate during the final 10 cardiac cycles of apnea after normocapnic normoxia (circles), hypercapnia (squares), hypoxia (triangles), and hypercapnic hypoxia (diamonds) relative to the resting heart rate averaged from 1 min preceding each respective apnea (n = 25, 12 females). The nadir is the mean response of each participant's single lowest beat during the final 10 cardiac cycles of each apnea. *comparison between normocapnic normoxia versus hypoxia; †comparison between normocapnic normoxia versus hypercapnic hypoxia.
