
FIGURE 4.
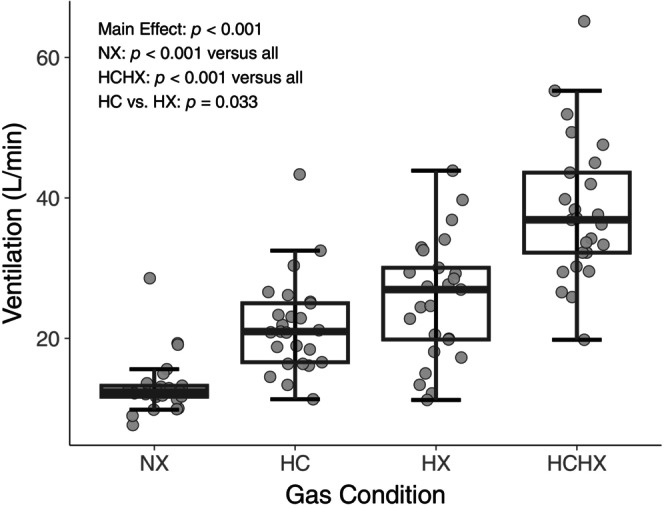
Ventilatory response to normocapnic normoxia (NX), hypercapnia (HC), hypoxia (HX), and hypercapnic hypoxia (HCHX; all n = 25, 12 females). ANOVA and post hoc p values are presented in the figure. All pairwise comparisons were statistically significant (p < 0.05).