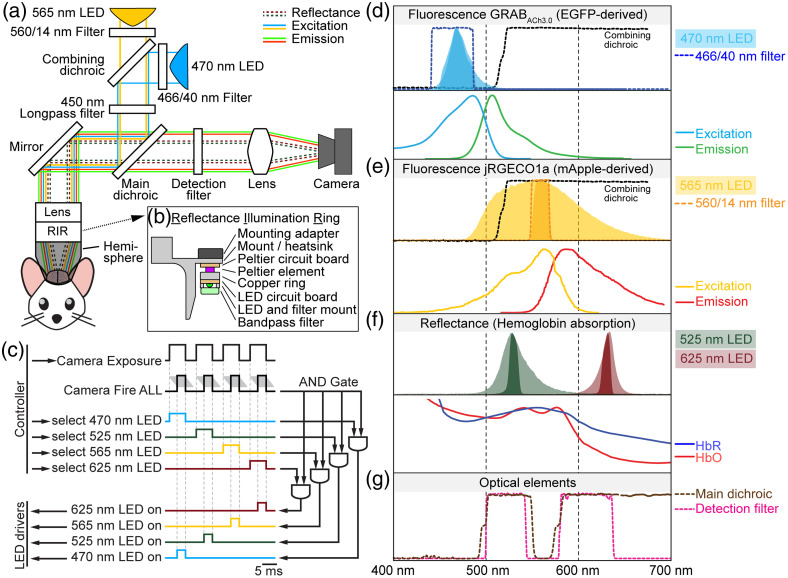
Fig. 1.
Schematics of the wide field imaging system and fluorescence and reflectance spectra. (a) A single sCMOS camera is used to measure emission of green and red fluorophores and two hemoglobin absorption wavelengths. A 565-nm LED excites mApple-based jRGECO1a and a 470-nm LED excites EGFP-based ; both LEDs are filtered through excitation filters. The main dichroic mirror reflects excitation light toward a 45-deg-mirror and then a 0.63× objective lens to focus the excitation light onto the sample. Below the objective lens is the reflectance illumination ring (RIR) further detailed in panel (b). An aluminum hemisphere between the RIR and the sample surface internally reflects the 525- and 625-nm LEDs for diffuse illumination and prevents specular reflections and illumination light from reaching the animal’s eyes. Fluorescence emission and reflectance pass the main dichroic and the detection filter before being focused by a tube lens to the camera. (b) Cross section of the RIR setup. Each of the six 525- and 625-nm LEDs are arranged on a ring-shaped board at equal distances. Peltier elements actively cool the LEDs to prevent temperature changes resulting in unstable illumination intensities. 10-nm wide excitation filters are mounted in front of each LED. (c) Timing diagram to trigger LEDs and camera acquisition: MATLAB controls the DAQ system via digital triggers controlling camera and LED drivers. A different LED illuminates the sample during each frame for near-simultaneous acquisition. The effective frame rate is determined by the length of the four-frame cycle (typically 100 ms). Grey lines next to the camera Fire ALL trigger represent exposure of pixel rows in rolling shutter mode. The Fire ALL trigger is sent when exposure overlaps for all rows. Each LED driver (bottom left) is controlled by the output of a separate AND gate. The Fire ALL trigger is the common input to every AND gate, whereas the individual LED selection triggers are the second input for each AND gate. (d). Top: light-blue and dark-blue shaded areas represent the 470-nm LED spectrum before and after passing the excitation filter (BP466/40, blue dotted line). Bottom: excitation (solid blue line) and emission (solid green line) spectrum of EGFP-derived .17 (e) Top: light-orange and dark-orange areas represent the 565-nm LED spectrum before and after passing the excitation filter (BP560/14, orange dotted line). Bottom: excitation (solid yellow line) and emission (solid red line) spectrum of mApple-derived jRGECO1a.16 (f) Top: LED spectra are confined by excitation filters (525 nm in light and dark green; 625 nm in light and dark red before and after passing through the respective excitation filters). Bottom: absorption spectra of oxyhemoglobin (HbO, red line) and deoxyhemoglobin (HbR, blue line) from Prahl.47 (g) Spectra of the main dichroic (brown) and detection filter (pink). Light must pass through both filters to reach the camera.

