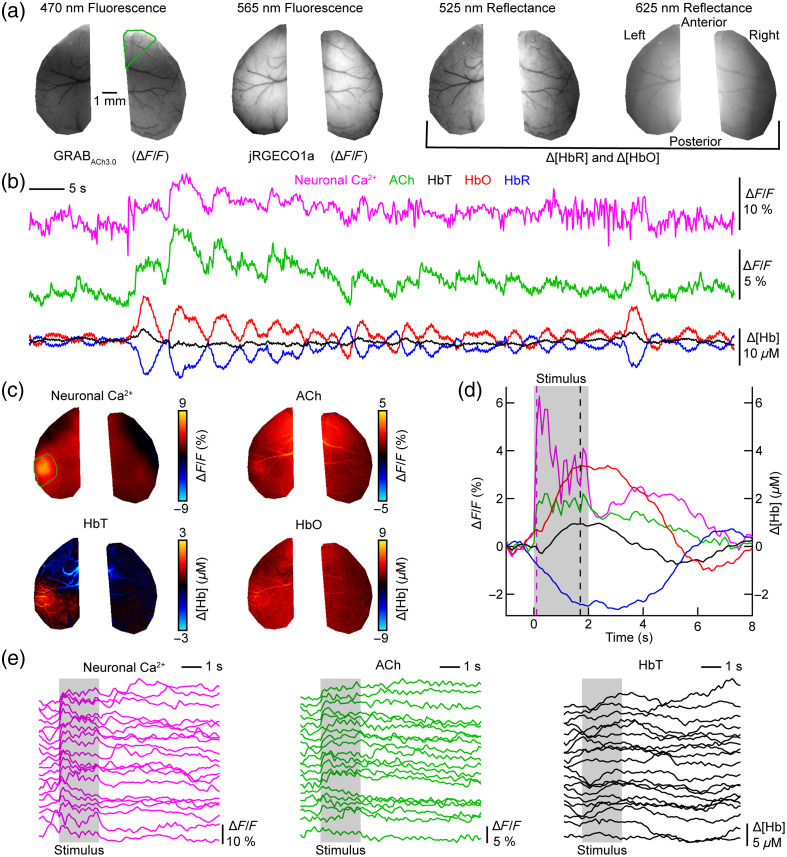
Fig. 2.
Spontaneous and stimulus-evoked activity in the somatosensory cortex. (a) Average of the first ten images collected during a 10-min acquisition period for each illumination wavelength. The two hemispheres were manually masked around the cranial window. A green polygon was drawn around the right secondary motor cortex, which was determined by registration to the Allen Atlas.49 (b) Spontaneous activity in the right secondary motor cortex [green polygon in panel (a)] for calcium, acetylcholine (ACh), and oxygenated, deoxygenated, and total hemoglobin (HbO, HbR, and HbT). (c) Ratio maps averaged across 20 trials showing the response to a 2-s, 3-Hz train of air puffs to the right whisker pad. Maps show data from 1.7 s after stimulus onset except for the calcium map, which shows data from 0.1 s after stimulus onset. (d) Average time course of the stimulus-evoked response in the contralateral barrel cortex [green region in panel (c)]. The pink dashed line indicates when the calcium ratio map in panel (c) is shown, whereas the black dashed line indicates when ACh, HbT, and HbO ratio maps in panel (c) are shown. The gray-shaded area indicates the duration of the stimulus. (e) Response of the contralateral barrel cortex to individual stimulus trains. The trials are sorted according to the magnitude of the calcium response.

