Figure 4.
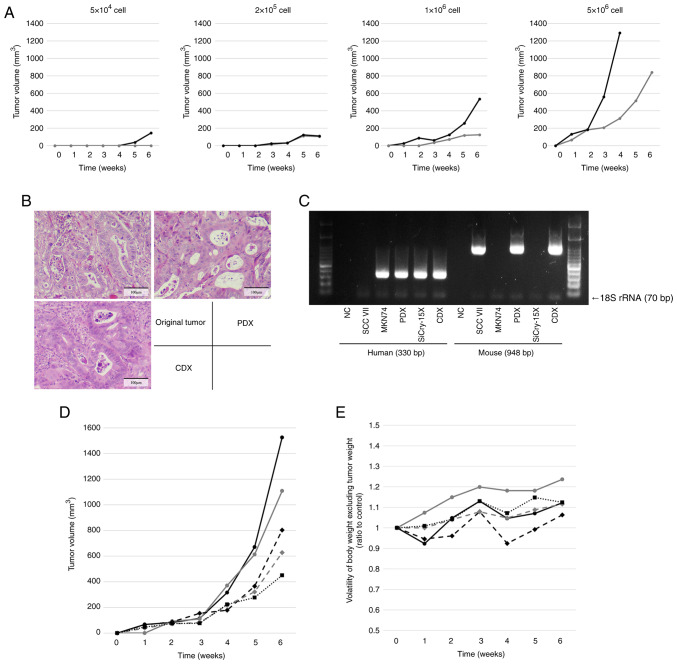
In vivo experiments to evaluate tumorigenicity and establish CDX model. (A) Plots of tumor progression at different cell counts for cells injected subcutaneously into nude mice (n=2). Tumors formed at all cell counts at 6 weeks, but only one of the two mice formed a tumor when injected with 5×10⁴ cells. Conversely, one of the mice injected with 5×10⁶ cells developed a tumor with a length that exceeded 15 mm within <6 weeks; observations for this mouse were not recorded thereafter. (B) Hematoxylin and eosin-stained images of the original tumor, PDX and CDX. The CDX retained atypical glandular duct structures similar to those of the original tumor and PDX. Scale bar=100 µm. (C) Amplification of human- and mouse-specific mitochondrial DNA. CDX contains both human and mouse components, similar to that observed in PDX. Plots of (D) tumor volume progression and (E) volatility of body weight, excluding the estimated tumor weight, for nude mice injected subcutaneously with 2×10⁶ cells (n=5). All mice showed tumor growth, and none showed excessive weight loss. CDX, cell-derived xenograft; PDX, patient-derived xenograft; NC, negative control; rRNA, ribosomal RNA.

