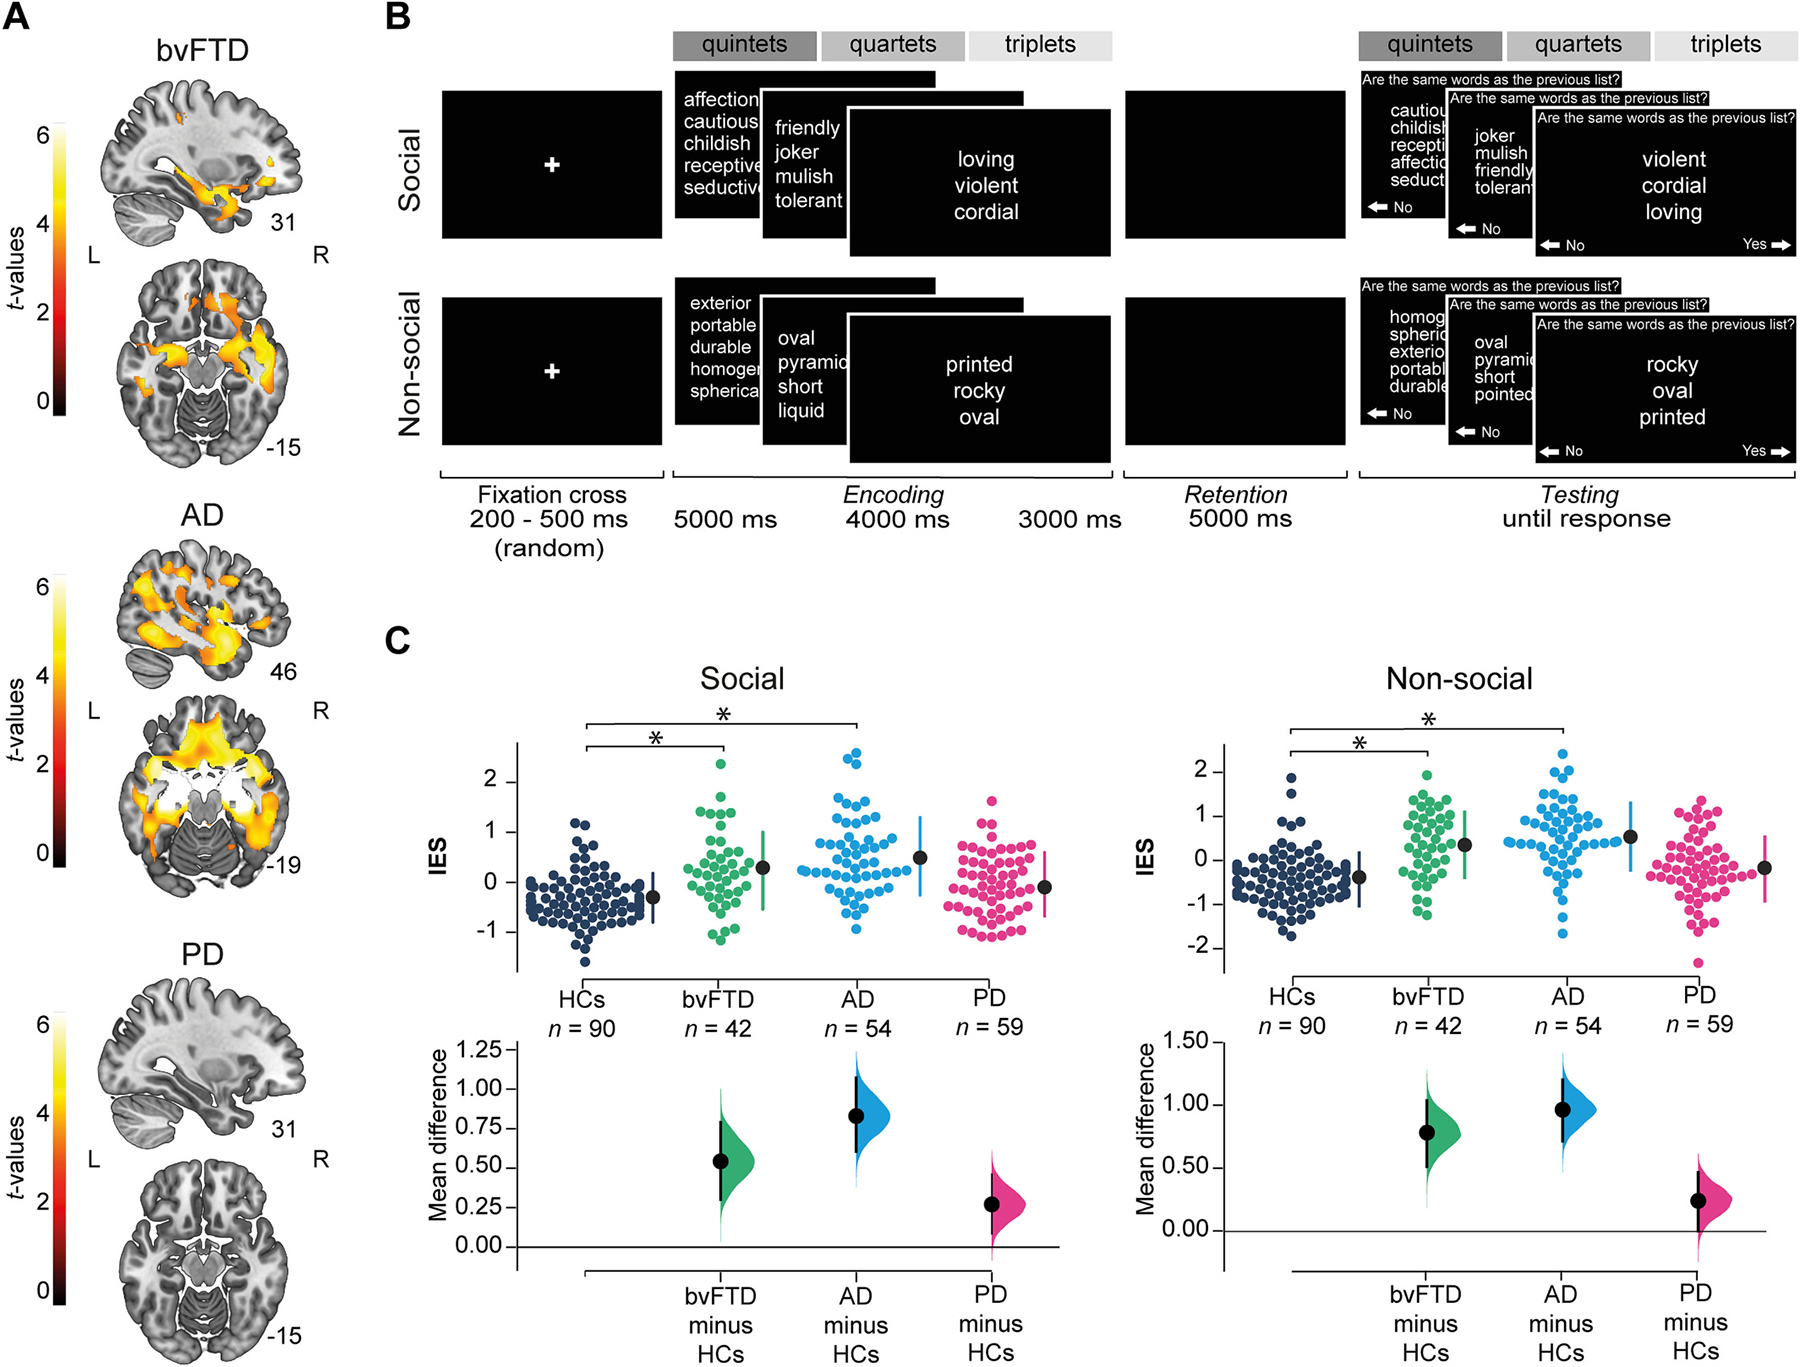
Fig. 1.

GM atrophy, task design and behavioral results. (A)GM atrophy in patients. GM integrity was assessed via voxel-based morphometry, based on w-score maps of the normalized and smoothed DARTEL outputs (Chung et al., 2017; Jack et al., 1997; La Joie et al., 2012; Ossenkoppele et al., 2015; van Loenhoud et al., 2017). We ran two sample t-tests between each neurodegenerative group and HCs using the statistical non-parametric mapping (SnPM13) toolbox for SPM12 (5000 random permutations, P<0.001 for cluster-forming threshold, and P<0.05 FWE-corrected for cluster-wise threshold (Kim et al., 2020; Salamone et al., 2021; Shih et al., 2019)). BvFTD showed orbitofrontal-cingulate-temporal atrophy. AD showed bilateral temporal with less extended frontoparietal atrophy. No atrophy was found in PD (Table S1.2). Results are presented on MNI space using the AAL(Tzourio-Mazoyer et al., 2002), in neurological convention. (B) Task design. Participants judged if adjectives from a second list (testing phase) were the same as those from a first list (encoding phase) after a retention phase. Adjectives were either social or non-social (stimulus type) and randomly presented in three load levels: quintets, quartets or triplets (dark, medium and light gray, respectively). Note: Adjectives were displayed and validated in Spanish (Material S2). English translations are simply communicative renditions for the benefit of non-Spanish readers. (C)Behavioral results: between-group comparisons. We compared the WM performance of HCs and patient groups via mixed model ANOVA (group[4]*type[2]*load[3]) and post-hoc Tukey comparisons using the normalized inverse efficiency score (IES). Significant results were found for group-by-type (plotted) and group-by-load interactions (Table 2, Fig. S1, Fig. S2, Material S4.) Dot-plots represent results for HCs (dark blue), bvFTD (turquoise), AD (light blue), and PD (pink). Vertical-dotted lines show mean (black dot) and standard deviation (lines). The asterisk indicates significant differences (P<0.05). The between-groups mean difference (effect size) between each patient group and HCs is reported below each result. AD: Alzheimer’s disease, bvFTD: behavioral-variant frontotemporal dementia, GM: grey matter, HCs: healthy controls, L: left, PD: Parkinson’s disease, R: right, WM: working memory.
