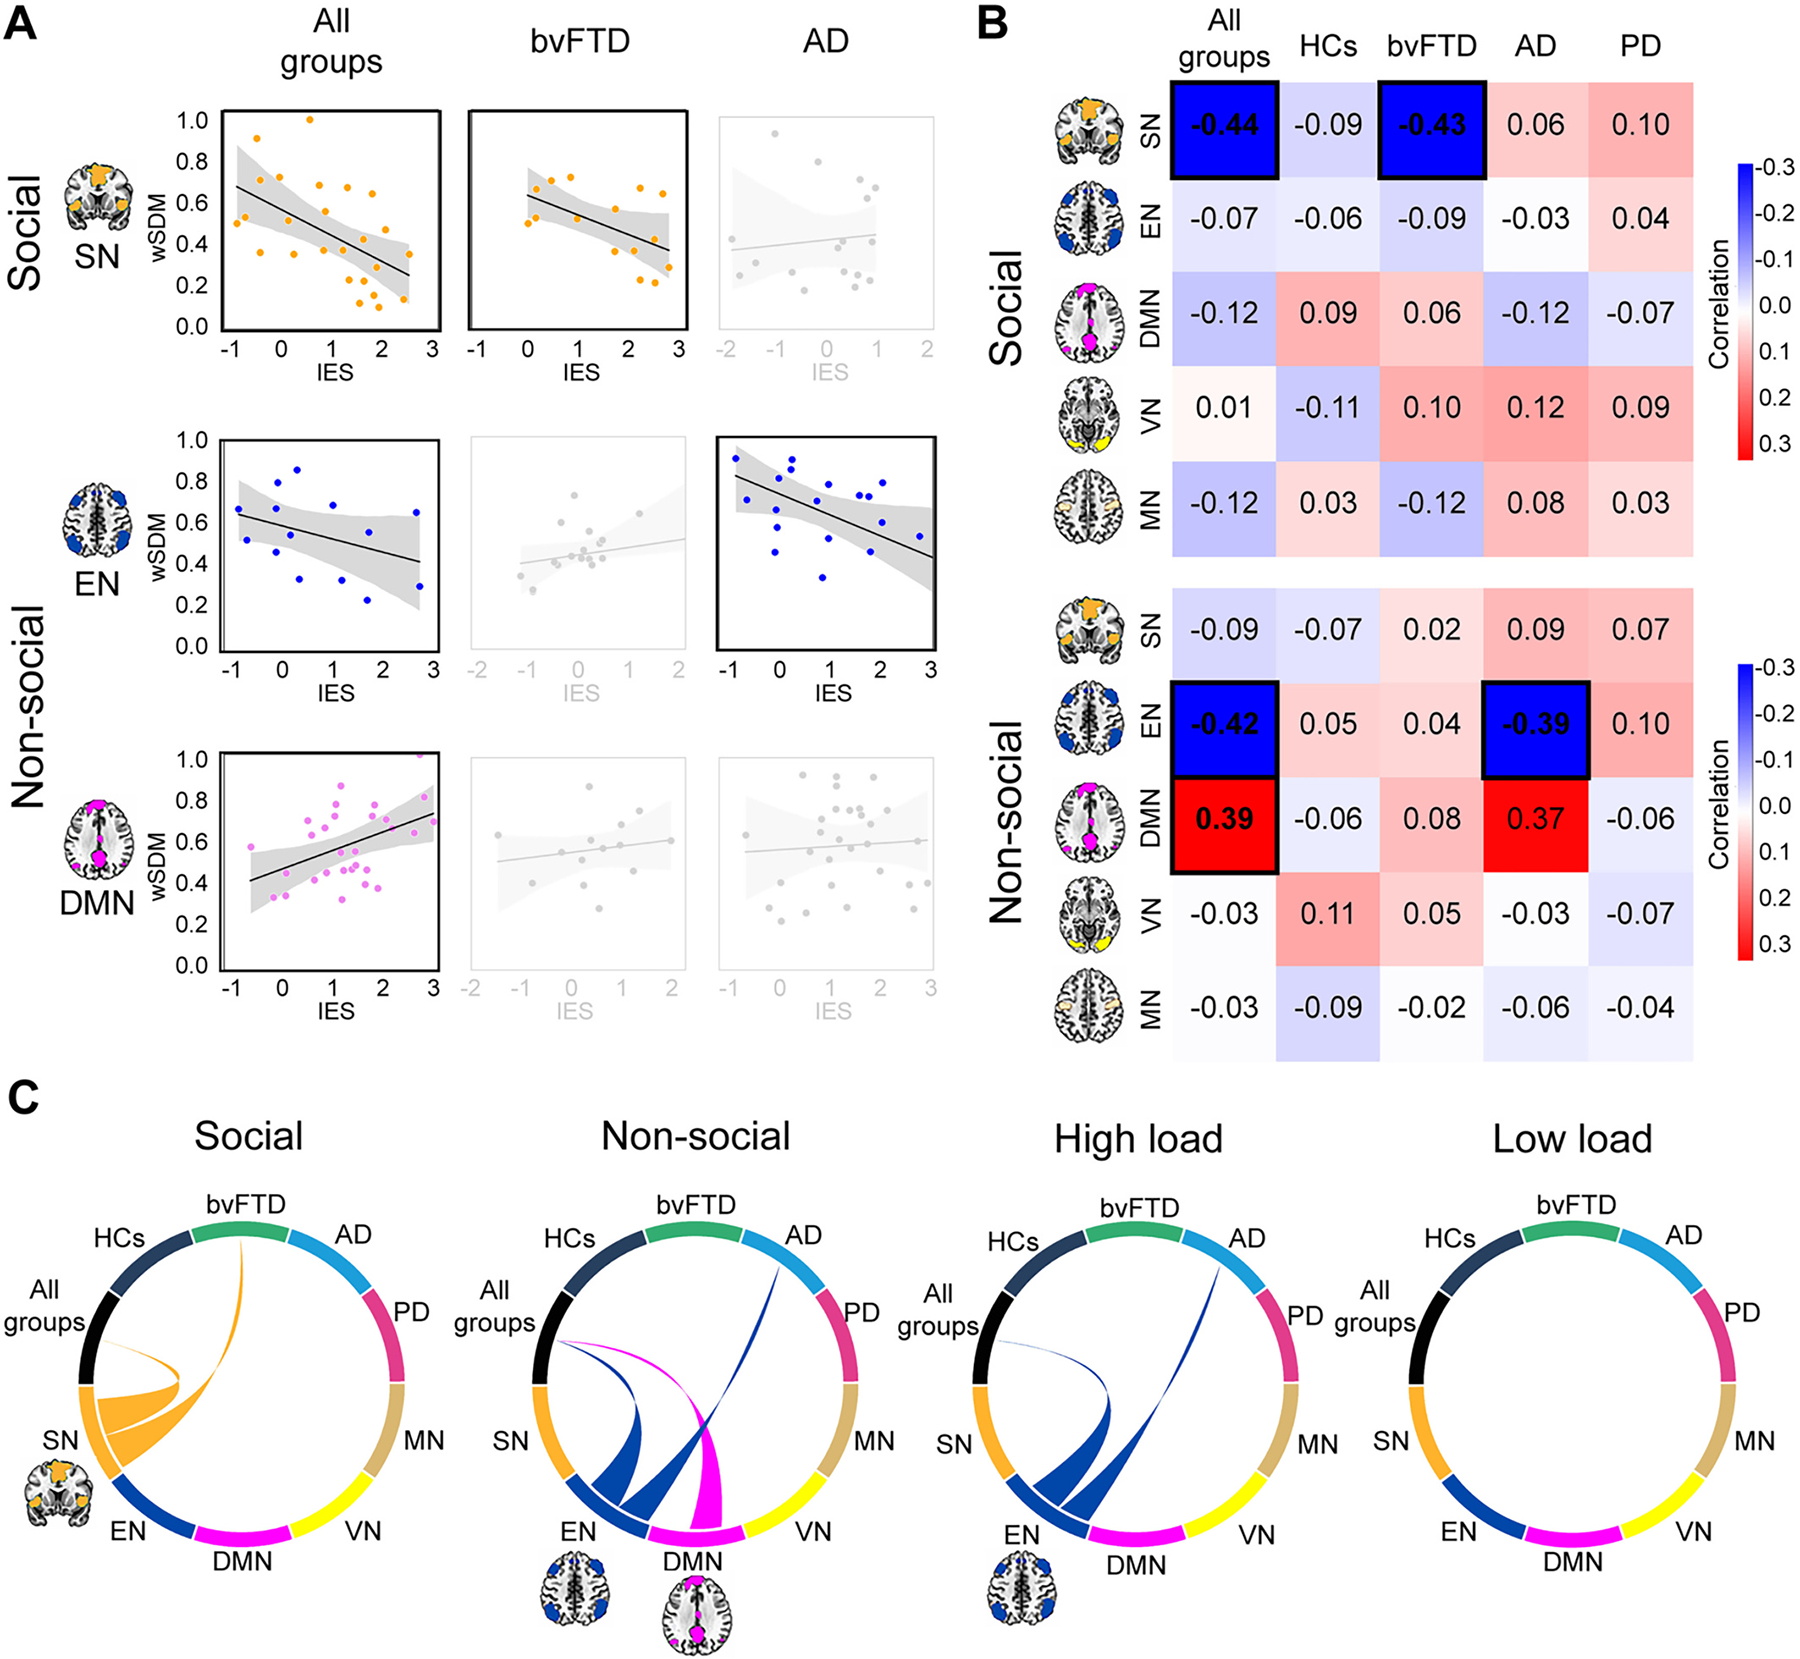
Fig. 3.

Associations between networks and WM. Seed analyses over five networks (SN, EN, DMN, VN, MN, P≤0.05 FDR-corrected) were performed to test the association between each network’ functional connectivity and WM performance (normalized IES) for social and non-social stimuli, and for high (quintets) and low (triplets) load levels. Analyses were run in all groups together and individually for HCs, bvFTD, AD and PD (Table 5). (A) Target network associations for stimulus type. Associations are plotted between target networks (SN, EN and DMN) and WM for social and non-social stimuli. WM for social stimuli was significantly linked to the SN in all groups together and in bvFTD. WM for non-social stimuli was significantly linked to the EN in all groups together and in AD, and to the DMN in all groups together. Black-border squares indicate significant associations. For HC and PD non-significant associations see Fig. S4. (B) Correlation matrix for each stimulus type. Correlation matrix for social and non-social stimulus type across all groups together and individual groups. Black-border squares indicate significant associations. (C) Functional connectivity associations for each stimulus type and load level. Circular plots represent all functional connectivity correlations between groups (upper semi-circle) and brain networks (lower semi-circles). Links represent significant group-network correlation. They are color-coded according to the network. High load (quintets) WM significantly correlated to the EN in all groups together and in AD. Non-significant results were found across associations with low load (for further details see Fig. S4). Results were obtained with a demographically matched sample (Table S3.2) and across scanners (Table S3.3). Standard masks (Shirer et al., 2012) were used to isolate the voxels involved in each network in MNI anatomical space. None of the participants showed head movements greater than 3 mm and/or rotations higher than 3° (Table S3.4). AD: Alzheimer’s disease, bvFTD: behavioral-variant frontotemporal dementia, DMN: default mode network, EN: executive network, HCs: healthy controls, IES: inverse efficiency score, MN: motor network, PD: Parkinson’s disease, SN: salience network, VN: visual network, wSDM: weighted Symbolic Dependence Metric.
