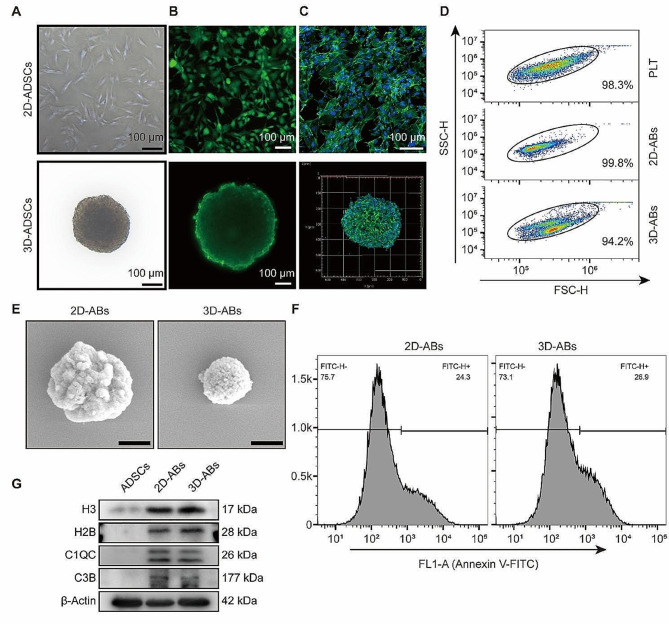
Fig. 1.
Isolation and characterization of 2D and 3D-ABs. (A) The morphology of 2D and 3D-mADSCs. (B) Representative live/ dead images of 2D and 3D-mADSCs. (C) F-actin immunofluorescence of 2D and 3D-mADSCs (nuclei: hoechst 33,342). (D) FSC/SSC analysis of 2D and 3D-ABs. Frames were used as size marker (platelet, PLA, 1–4 μm) gating 2D and 3D-ABs. (E) SEM micrographs of 2D and 3D-ABs. Scale bar, 0.5 μm. (F) Using annexin V-FITC staining, FCM analysis was used to identify the 2D and 3D-ABs (n = 3). (G) WB analysis of C1QC, H3, C1QC, C3B, H2B and β-Actin in the indicated groups

