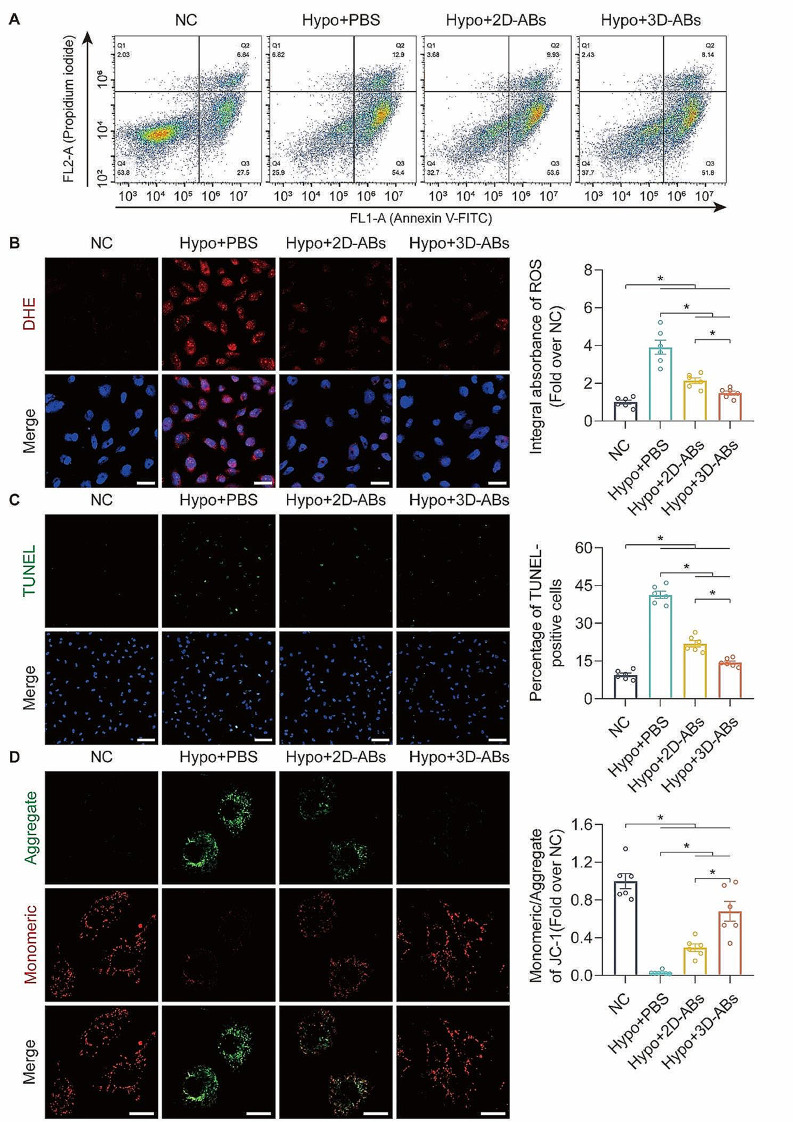
Fig. 3.
3D-ABs inhibited oxidative stress and apoptosis of HUVECs. (A) Hypo-HUVECs treated after 24 h among the four groups determined by FCM analysis using annexin V and PI staining (n = 3). (B) DHE staining to detect ROS damage in Hypo-HUVECs among the four groups (nuclei: hoechst 33,342). Scale bars, 50 μm. Analysis and quantification of DHE integral absorbance in each of the four groups (n = 6). (C) TUNEL staining to detect cell death of Hypo-HUVECs among the four groups (nuclei: hoechst 33,342). Scale bars, 100 μm. Analysis and quantification of TUNEL-positive HUVECs among the four groups (n = 6). (D) Representative images of JC-1 staining in Hypo-HUVECs among the four groups after treatment for 24 h. Scale bars, 20 μm. Quantification of the ratio of monomeric/aggregated JC-1 among the four groups after treatment for 24 h (n = 6). SEM error bars are used. Significance (*): p value < 0.05; equal variances ANOVA with LSD post hoc analysis or unequal variances Dunnett’s T3 technique

