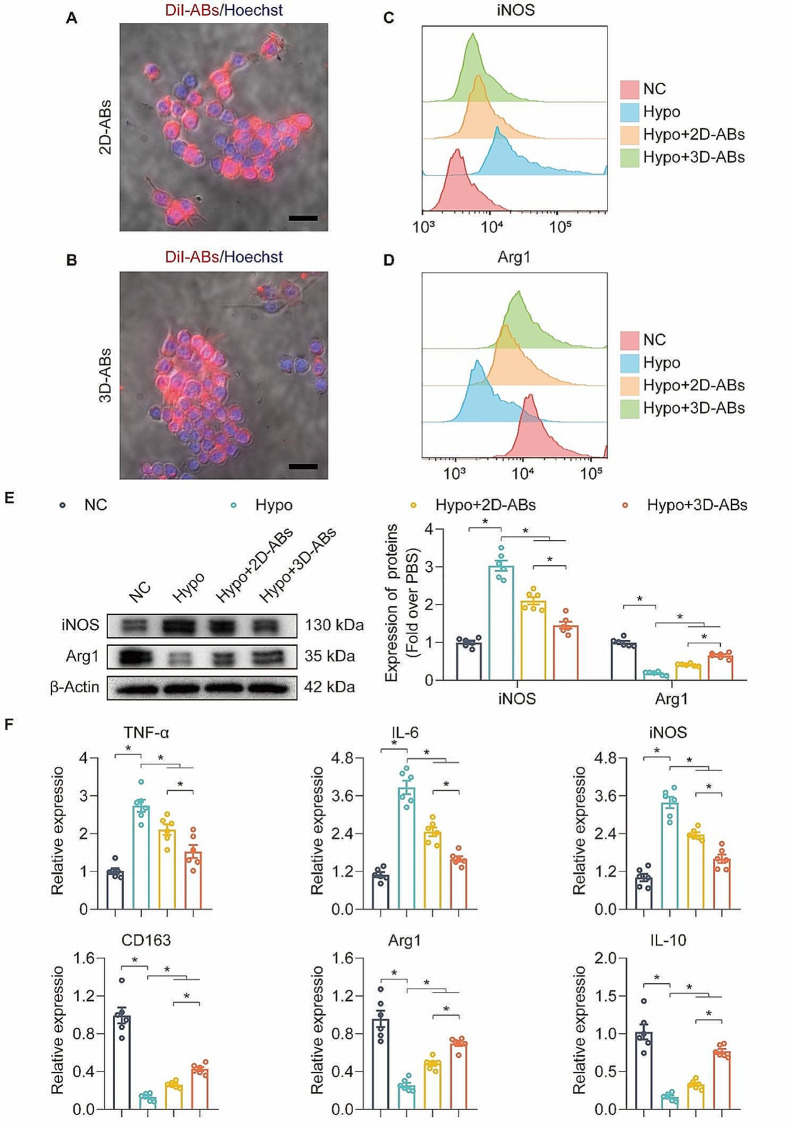
Fig. 4.
3D-ABs promoted the M1 to M2 polarization in macrophages in vitro. (A) The uptake of 2D-ABs was seen in RAW 264.7 cells using confocal microscopy. (B) The uptake of 3D-ABs was seen in RAW 264.7 cells using confocal microscopy. (C) After treatment for 24 h (n = 3), FCM analysis of M1 (iNOS) Raw264.7 cells was performed across the 4 groups. (D) After treatment for 24 h (n = 3), FCM analysis of M2 (Arg1) Raw264.7 cells was performed across the 4 groups. (E) After treatment for 24 h, WB analysis of iNOS and Arg1 proteins level in RAW264.7 cells was performed across the 4 groups. Quantified proteins level among the four groups. β-Actin served as a loading control and for band density normalization (n = 6) (F) Comparison of the relative TNF-α, IL-6, iNOS, CD163, Arg1 and IL-10 expression levels in RAW264.7 cells among the four groups after treatment for 24 h (n = 6). SEM error bars are used. Significance (*): p value < 0.05; equal variances ANOVA with LSD post hoc analysis or unequal variances Dunnett’s T3 technique

