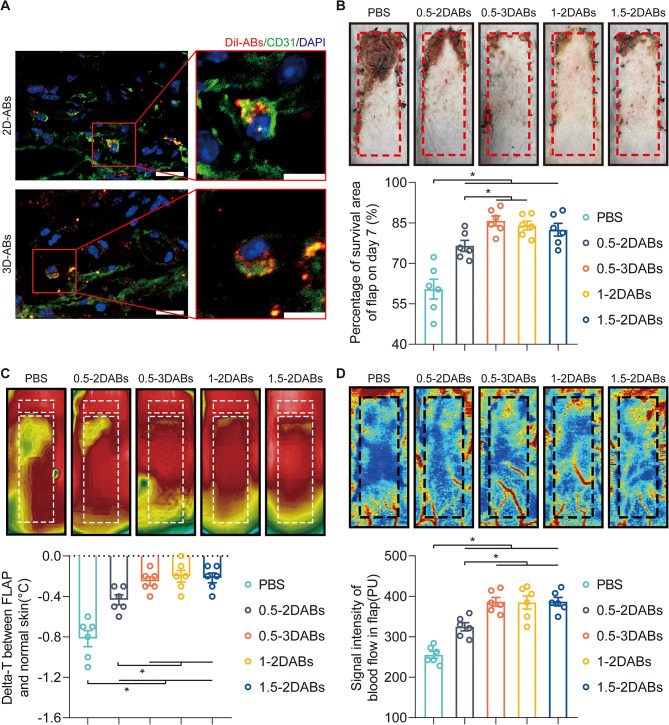
Fig. 5.
3D-ABs promoted the survival of ischaemic flaps. (A) Uptake of 2D and 3D-ABs in CD31-positive cells on POD3 detected by confocal microscopy. Left scale bar: 20 μm; right scale bar: 10 μm. (B) Digital photograph of the flap survival area on POD7. Quantified percentage of survival area among the five groups on POD7 (n = 6). (C) Thermal images of the flap on POD7. Comparison of the Delta-T between the flap and normal skin among the five groups on POD7. (D) Images of the subcutaneous blood flow network on POD7. Quantified blood flow signal intensity in ischaemic flaps among the five groups on POD7 (n = 6). SEM error bars are used. Significance (*): p value < 0.05; equal variances ANOVA with LSD post hoc analysis or unequal variances Dunnett’s T3 technique

