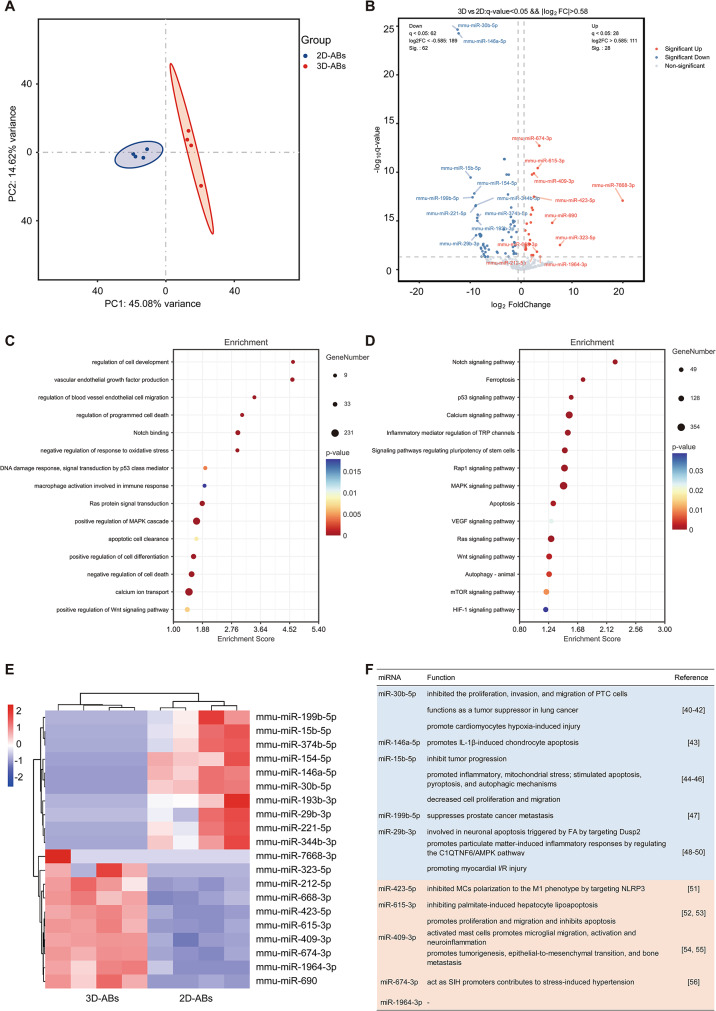
Fig. 8.
Differential miRNA profiles of ABs were produced by 3D cultivation of mADSCs. (A) Principal component analysis (PCA) of the miRNAs in 2D- and 3D-ABs was carried out. (B) To show which miRNAs were differently expressed, a volcano plot was created. (C) Target genes linked to biological processes that were inferred from differentially expressed miRNAs in 3D-ABs underwent GO analysis. (D) Target genes identified from differentially expressed miRNAs in 3D-ABs were analyzed using the KEGG. (E) In comparison to 2D-ABs, the top 10 miRNAs that were up- and down-regulated in 3D-ABs were plotted on a heatmap. (n = 4) (F) Compared to 2D-ABs, the biological roles of the top 10 up- and down-regulated miRNAs in 3D-ABs were investigated

