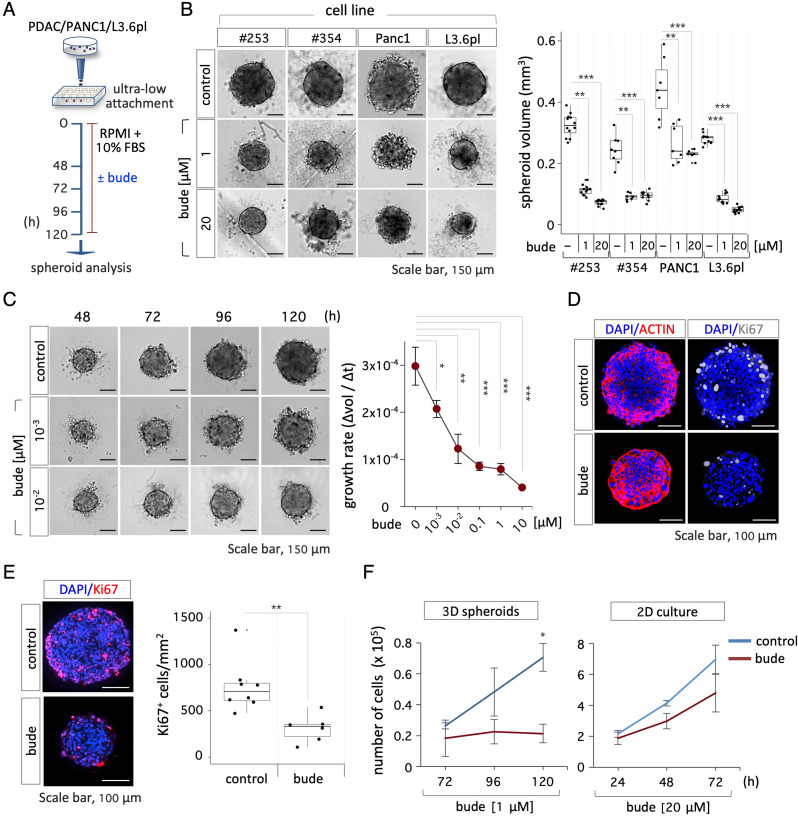
Fig. 3.
Budesonide reduces the growth of pancreatic cancer cell spheroids. A Schematic representation of the experimental design. PDAC (#253 and #354), PANC1 and L3.6pl cells were seeded (5 × 10² cells/well) in ultra-low attachment plates ± budesonide (from 10− 3 µM to 20 µM) or DMSO (control) for 5 days. B Representative pictures (left) of PDAC (#253, #354), PANC1 and L3.6pl spheroids ± budesonide (1 and 20 µM) and quantification (right) of the spheroid volume. Data are mean ± SD (**p < 0.005, ***p < 0.001; n = 3, Student’s t-test). C Representative pictures (left) and growth rate (right) of PDAC#253 spheroids ± budesonide calculated as the mean of the ratio between the Δvolume and the Δtime (48, 72, 96 and 120 h). Data are mean ± SEM (*p < 0.05; **p < 0.005, ***p < 0.001; n = 3, Student’s t-test). D Representative confocal images of ACTIN (red) and Ki67 (grey) staining in PDAC#253 spheroids ± budesonide (1 µM). Nuclei were counterstained with DAPI (blue). E Representative images (left) and quantification (right) of Ki67 (red) staining in cryo-sections of PDAC#253 spheroids. Nuclei were counterstained with DAPI (blue). The number of Ki67+ cells/area is shown as mean ± SD (**p < 0.005; n = 3, Student’s t-test). F Time course quantification of cell number in 3D spheroids (left) and 2D cultures (right) of PDAC#253 cells treated ± budesonide at the indicated concentrations. Data are mean ± SD (*p < 0.05; n = 3, Student’s t-test)

