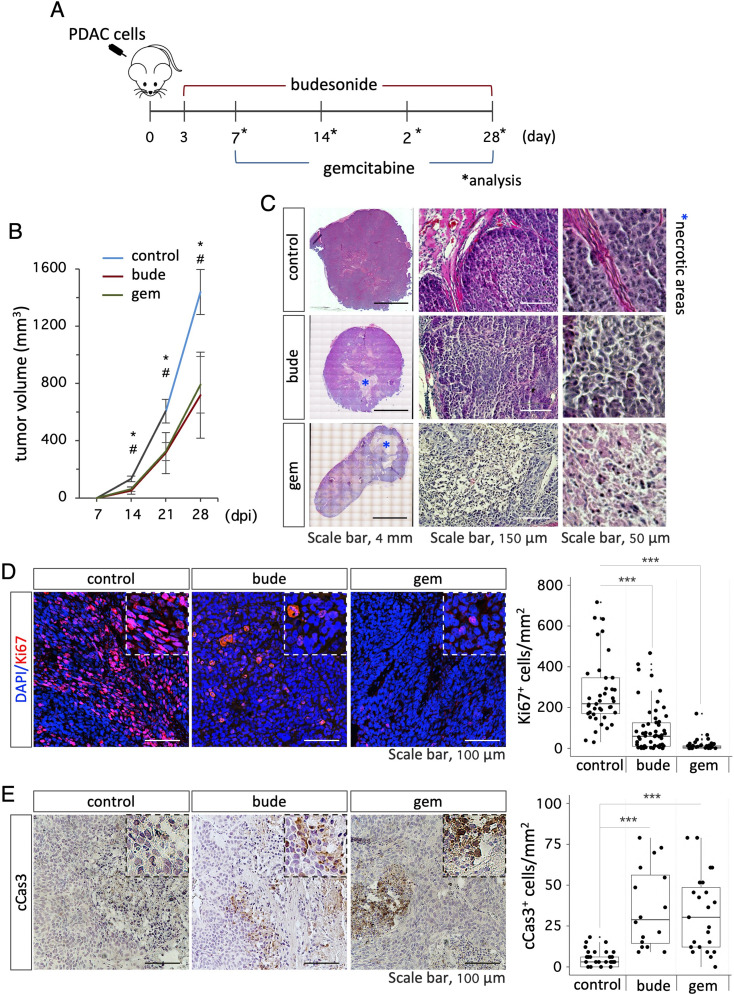
Fig. 4.
Budesonide reduces PDAC tumor growth in vivo. A Schematic representation of the experimental procedure. CD1 athymic nude mice were subcutaneously injected with PDAC#253 cells (3 × 10⁵ cells/flank) and injected intraperitoneally (i.p.) with either budesonide (3 mg/Kg) everyday, vehicle (control) or gemcitabine (125 mg/Kg) 2 times/week. B Quantification of tumor volume (mm3) in mice injected with budesonide (bude), gemcitabine (gem) or vehicle (control). Data are mean ± SEM. n≥ 5 mice/group; n≥ 10 tumors/group. # and * indicate the significance (p < 0.05) of budesonide (bude) and gemcitabine (gem) vs. control (vehicle), respectively. dpi = days post inoculations. C Representative images of H&E-stained tumor sections from control (vehicle), budesonide (bude)- and gemcitabine (gem)- treated mice. Mosaic reconstruction (left) and higher magnifications (middle and right) of tumor sections are shown. Asterisks indicate necrotic areas. D Representative images (left) of Ki67 staining (red) and quantification (right) of Ki67+ cells in tumor sections from budesonide (bude)-, gemcitabine (gem)- and vehicle (control)- treated mice. Nuclei were counterstained with DAPI (blue). E Representative images (left) of cleaved Caspase3 (cCas3) immunohistochemistry and quantification (right) of cCas3+ cells in tumor sections from budesonide (bude)-, gemcitabine (gem)- and vehicle (control)-treated mice. Data are mean ± SD (***p < 0.001; n = 10–12 tumors/group)

