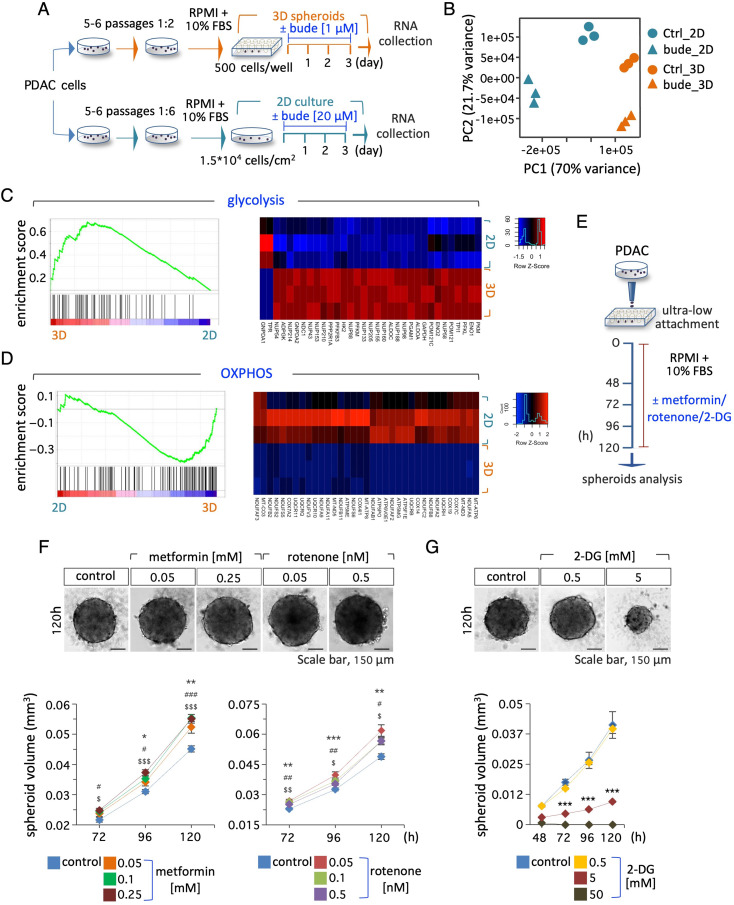
Fig. 6.
Transcriptome profiling of PDAC cells in 2D culture and 3D spheroids and sensitivity to energy metabolism inhibitors. A Schematic representation of the experimental procedure. PDAC#253 were either seeded in ultra-low attachment plates to form 3D spheroids or plated in 2D and treated ± budesonide at the indicated concentrations. DMSO was used as control. After 3 days, spheroids/cells were collected and RNA was extracted for RNA-Seq analysis. B Principal component analysis (PCA) of PDAC ± budesonide in 2D and in 3D culture. C, D GSEA plots related to glycolysis (C, left) and OXPHOS (D, left) positively and negatively enriched in 3D spheroids, respectively. Heatmaps of DEGs related to glycolysis (C, right) and OXPHOS (D, right) in control PDAC cells in 2D vs. 3D culture. E Schematic representation of the experimental design. PDAC cells were seeded (5 × 10² cells/well) in ultra-low attachment plates ± metformin, rotenone, 2-DG or DMSO (control) for 5 days. F Representative pictures (120 h) of PDAC spheroids (upper) ± metformin (0.05 and 0.25 mM) or rotenone (0.05 and 0.5 nM) at the indicated concentrations, and time course analysis (bottom) of spheroid volume at the indicated time points. DMSO was used as control. Data are mean ± SEM (*, # and $ indicate the significance of metformin- or rotenone- treated cells vs. control *p < 0.05, **p < 0.005, ***p < 0.001; n = 3, Student’s t-test). G Representative pictures (120 h) of PDAC spheroids (upper) ± 2-DG (0.5 and 5 mM), and time course analysis (bottom) of spheroid volume at the indicated time points. DMSO was used as control. Data are mean ± SEM (***p < 0.001; n = 3, Student’s t-test)

