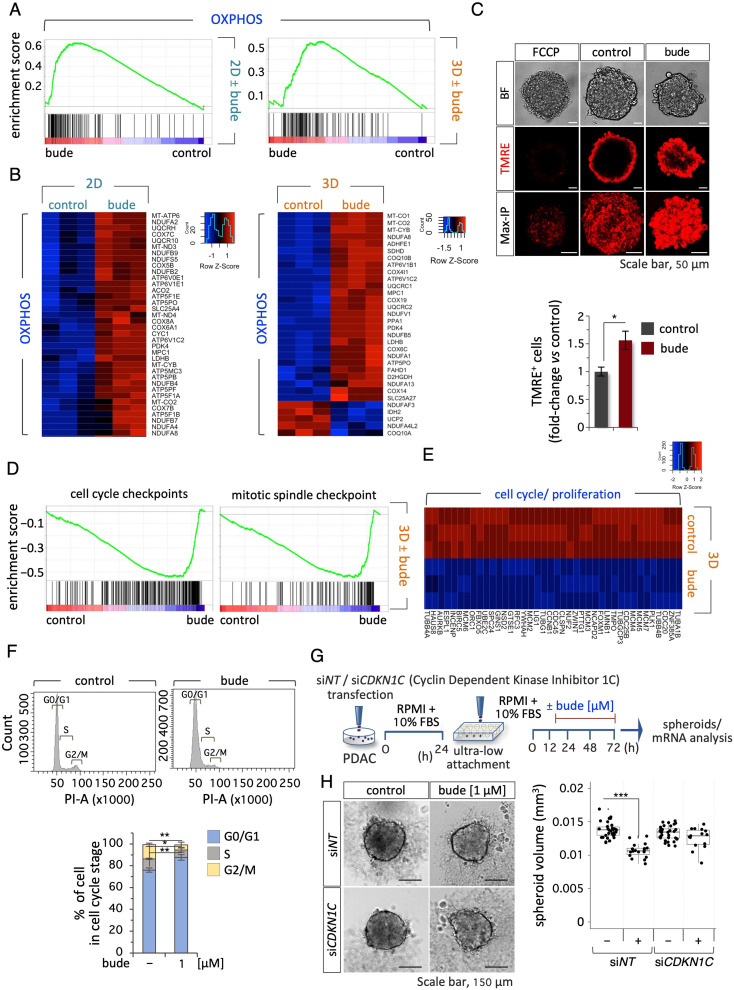
Fig. 7.
Budesonide induces metabolic remodeling in PDAC cells. A GSEA plots related to OXPHOS of positively enriched gene sets in budesonide (bude)- treated PDAC#253 in 2D (left) and 3D (right) culture. B Heatmaps of DEGs related to OXPHOS between control (DMSO) and budesonide-treated (bude) PDAC cells in 2D (left) and 3D (right) cultures. C Representative confocal images (upper) of TMRE staining (red) in PDAC spheroids ± budesonide (1 µM). Bright field (BF), TMRE and 3D Maximum projection intensity (Max-IP) are shown. Quantification by FACS analysis (bottom) of the percentage of TMRE+ PDAC cells ± budesonide (1 µM) in 3D culture. Data are shown as fold-change vs. control (DMSO) and are mean ± SEM (*p < 0.05; n = 3, Student’s t-test). D GSEA plots related to cell cycle checkpoint (left) and mitotic spindle checkpoint (right) of negatively enriched gene sets in budesonide-treated (bude) PDAC cells in 3D culture. E Heatmap of DEGs related to cell cycle and proliferation between control and budesonide-treated PDAC cells in 3D culture. F Representative flow cytometric histogram plots (upper) and quantification (bottom) of cell cycle analysis of PDAC spheroids ± budesonide (1 µM). Data are mean ± SEM (*p < 0.05, **p < 0.005; n = 3, Student’s t-test). G Schematic representation of the experimental procedure. PDAC#253 cells were transfected with a siRNA targeting CDKN1C or with a non-targeting siRNA (siNT) as control. After 24 h, cells were seeded (500 cells/well) in ultra-low attachment 96-well plates, and treated ± budesonide (1 µM). DMSO was used as control. H Representative pictures (left) and quantification (right) of spheroid volume of siCDKN1C and siNT PDAC spheroids ± budesonide (1 µM). Data are mean ± SD (***p < 0.001; n = 3, Student’s t-test)

