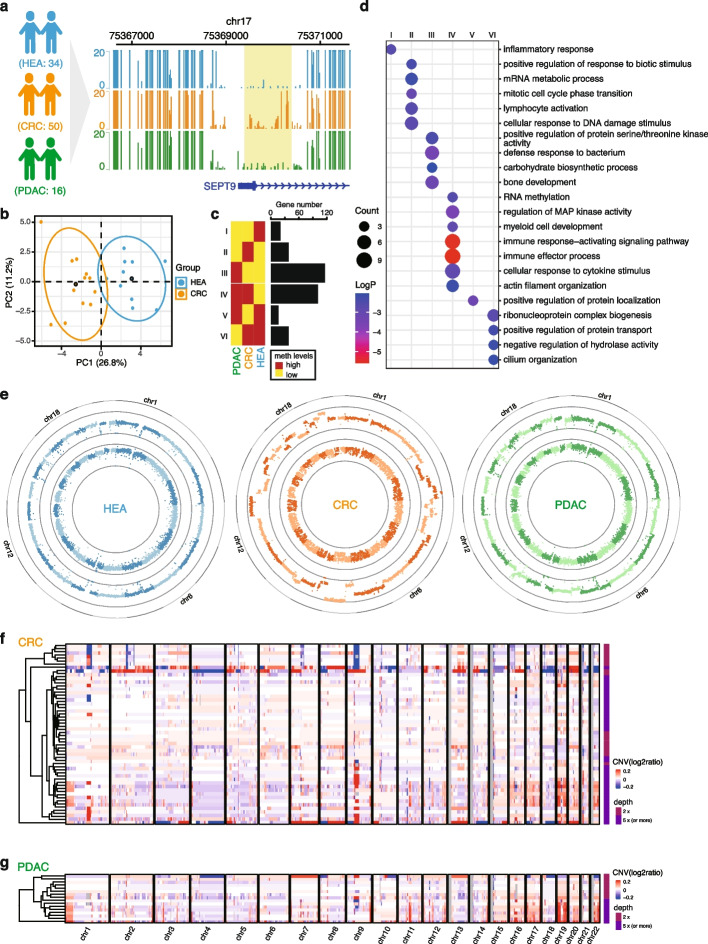
Fig. 2.
LABS reveals abnormal genomes and epigenomes in cfDNA. a Genome browser view of SEPT9 promoter regions for all 3 groups. The schematic of the clinical experiment design was shown on the left. CRC, colorectal cancer; HEA, healthy controls; PDAC, pancreatic ductal adenocarcinoma. b PCA plot showing that deep-sequenced CRC and HEA samples can be separated by methylation levels of promoters of 41 differentially expressed genes from TCGA. c Numbers of differentially methylated region-related genes in different combinations of comparisons across the three groups (FDR < 0.01, methylation difference > 15%). d Functional enrichment results of differential gene groups from c. e Circos plots showing the copy number alterations and methylation levels of 1 healthy control sample, 1 CRC sample, and 1 PDAC sample. Inner circles, methylation levels; outer circles, normalized copy numbers. f Heatmap showing the normalized copy numbers for all 50 CRC samples. Sequencing depth is shown on the right. g Heatmap showing the normalized copy numbers for all 16 PDAC samples. Sequencing depth is shown on the right

