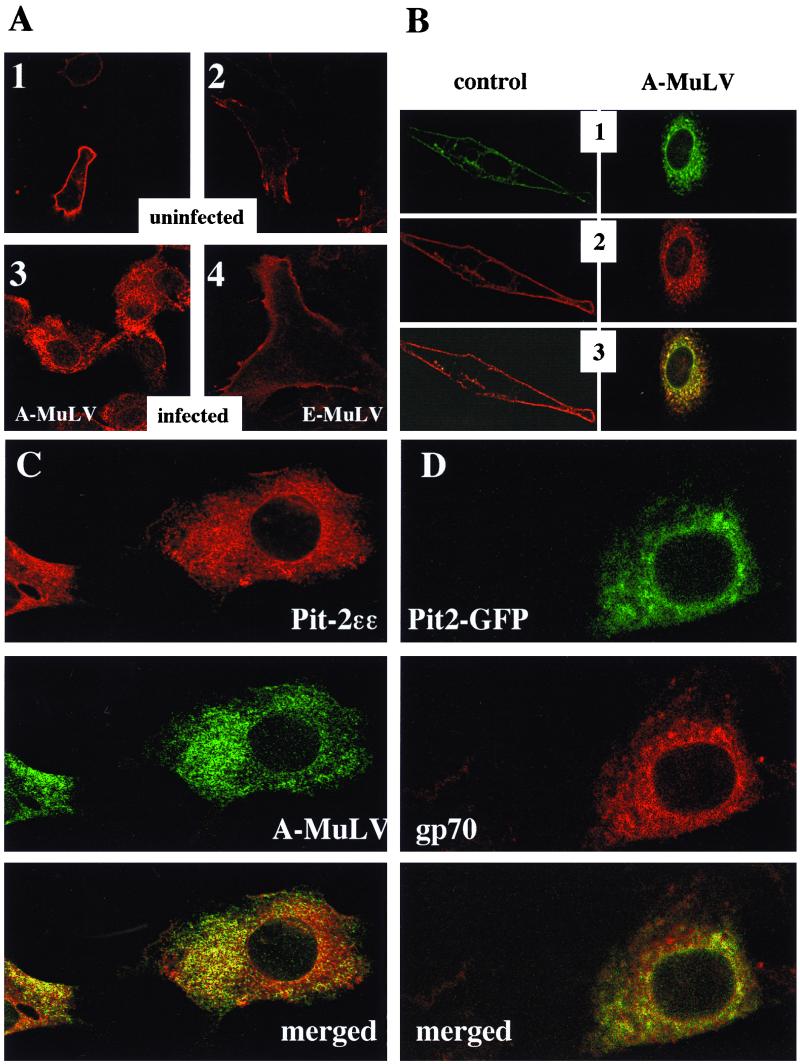
FIG. 3.
Immunocytochemical localization of ɛ-epitope-tagged Pit-2 transporter in uninfected (A, 1 and 2), and A-MuLV-infected (A, 3), and E-MuLV-infected (A, 4) overexpressor NIH 3T3 cells. ɛ-Tag antibodies (1:1,000 dilution) and Cy3-labeled anti-rabbit IgG (1:1,000 dilution) were used as primary and secondary antibodies, respectively, to stain for overexpressed Pit-2ɛɛ transporters. Views 1 and 2 in panel B depict dual imaging of control and A-MuLV-infected cells cooverexpressing both Pit-2–GFP chimeras and Pit-2ɛɛ, respectively. The coexpressed ɛ-epitope-tagged Pit-2 and the GFP-tagged Pit-2 were detected using fluorescent labeling and confocal laser microscopy as described in Materials and Methods. Panel C represents dual immunostaining of A-MuLV producer Pit-2ɛɛ-overexpressing NIH 3T3 fibroblasts with ɛ-tag antibodies and with A-MuLV pig antiserum. Cells were prepared and fixed on glass microscope slides as described in Materials and Methods. Pit-2ɛɛ staining with ɛ-tag antibodies was carried out as described in the legend to Fig. 2. The same cells were also stained for A-MuLV, using 1:500-diluted pig antiserum and 1:1,000-diluted fluorescein-conjugated anti-pig IgG secondary antibodies. Similarly stained uninfected and untransfected control NIH 3T3 cells were prepared to establish background levels for both the red and the green signals. Panel D shows A-MuLV-infected NIH 3T3 cells transiently transfected for 24 h with the pPit2-EGFPN1 construct and then stained for A-MuLV gp70 envelope protein with 1:500-diluted goat anti-Rausch murine leukemia virus gp69/71 antibody and 1:500-diluted Texas red-conjugated anti-goat IgG secondary antibodies. The distribution of Pit-2–GFP and A-MuLV gp70 protein was visualized under laser scanning confocal microscopy as described in Materials and Methods. The merged pictures of panels C and D resulted from merging the red and green signals.

