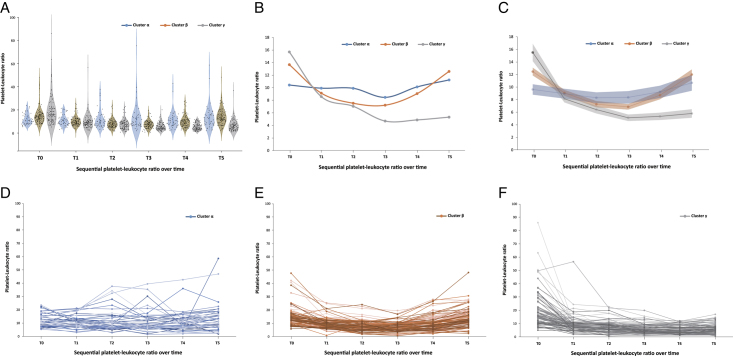
Figure 1.
Three trajectories of PWR in Type I Aortic Dissection. (A) Violin plot showing summary statistics of PWR for three cluster over time; (B) Trajectory plots with median of PWR for three cluster over time; (C) Trajectory plots with average and 95% predictive intervals of PWR for each cluster; (D) Spaghetti plots of PWR of each patient over time in cluster α; (E) Spaghetti plots of PWR of each patient over time in cluster β; (F) Spaghetti plots of PWR of each patient over time in cluster γ. PWR, platelet-white blood cell ratio.

