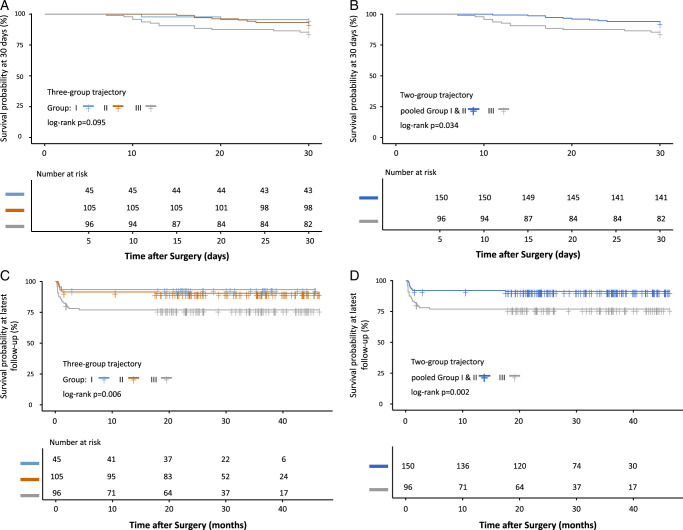
Figure 2.
Kaplan–Meier curve among PWR trajectory. A: Kaplan–Meier curve at 30 days among cluster α, β, and γ; B: Kaplan–Meier curve at 30 days among pooled cluster α and β and cluster γ; C: Kaplan–Meier curve at latest follow-up among cluster α, β, and γ; D: Kaplan–Meier curve at latest follow-up among pooled cluster α and β and cluster γ. PWR, platelet-white blood cell ratio.

