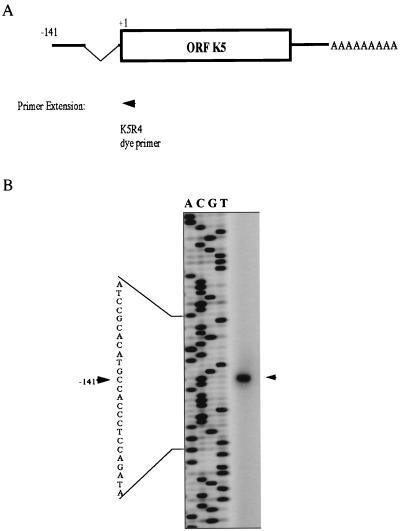
FIG. 5.
Map showing the K5 transcription pattern. (A) Schematic representation of the primer used in the primer extension assay and summary of the maps obtained using primer extension and 5′ and 3′ RACE. (B) Initiation site of the K5 transcript identified by primer extension. The size of the primer extension product is indicated by a sequencing ladder initiated with the same primer. The arrowhead indicates the position of the cDNA product, and the number indicates its position with respect to the initiation codon (ATG).

