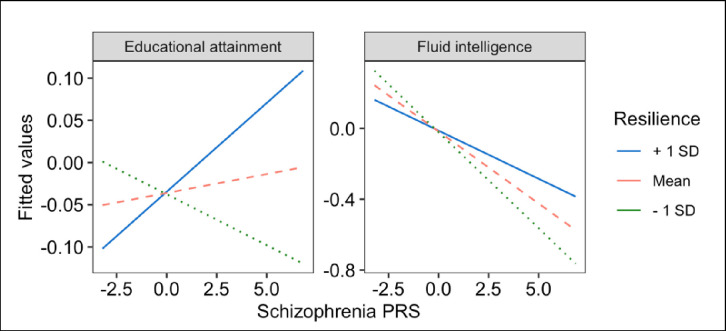
Figure 3.
Line graphs depicting statistically significant interactive effects of schizophrenia (SCZ) risk and resilience scores educational attainment and fluid intelligence scores obtained from UK Biobank participants at the time of enrollment. The results shown in this plot for resilience scores correspond to the scores calculated using resilience-associated SNPs that exhibit minimal linkage disequilibrium with mild-risk SNPs for SCZ (R2 value of 0.2 or less). The y-axes show the fitted probability values for each outcome measure. The lines in the plot depict the effects of SCZ risk at different levels of resilience. The solid blue line denotes the effect of SCZ risk among individuals with a resilience score one standard deviation above the sample mean. The dashed light-red line denotes the effect of SCZ risk at a mean level of resilience. The dotted green line denotes the effect of SCZ risk among individuals with a resilience score one standard deviation below the sample mean. We note that y-axes for all plots were scaled according to each outcome variable to enhance visualization of the interaction effects.

