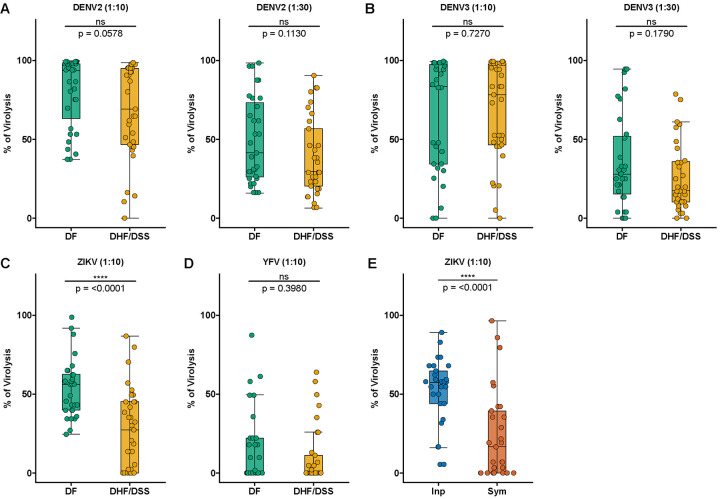
Fig. 2. Complement-mediated virolysis with ZIKV-cross-reactive antibodies is associated with protection from subsequent DHF/DSS and symptomatic DENV infection.
(A-D) Pre-infection plasma samples prior to DF (green; n=31) vs. DHF/DSS (gold; n=33) were incubated with mature DENV2, mature DENV3, ZIKV, and YFV virions. (A,B) Left panel, 1:10 dlution of plasma; right panel, 1:30 dilution of plasma. (E) Pre-inapparent (blue circles; n=30) and pre-symptomatic (orange circles; n=29) secondary DENV3 infection plasma samples were incubated with ZIKV virions. After incubation with plasma samples in the presence of guinea pig complement, mixtures were freeze-thawed once, followed by RNAse A digestion and RNA extraction from intact virions. Virion lysis was quantified by measuring viral RNA via RT-qPCR (to measure the number of genome copies) and calculated as percentage (%) of virion lysis as described in Methods. Shown are median NT50 (middle line), 25th to 75th percentile (box), and 5th to 95th percentile (whiskers) as well as the raw data (points). Asterisks indicate Benjamini-Hochberg-adjusted p-values for Mann-Whitney U tests (****p < 0.0001, and ns, non-significant).

