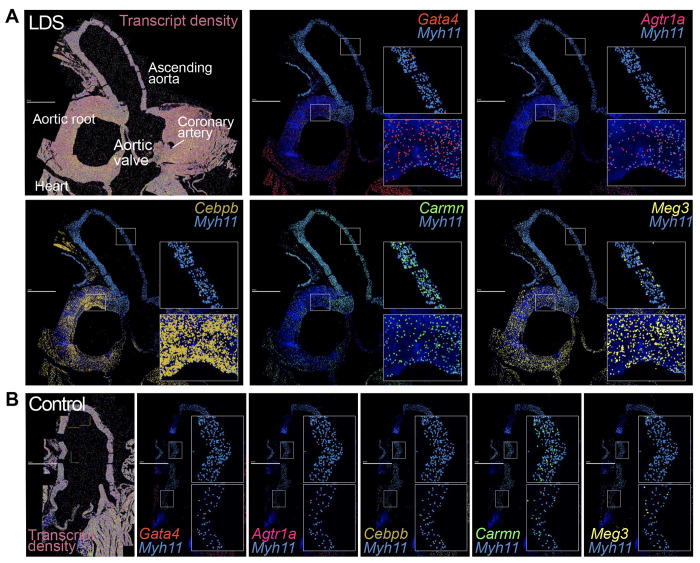
Figure 2. MERFISH reveals spatially heterogeneous transcriptional profiles in LDS VSMCs.
MERFISH images of the proximal aorta of LDS (A) and control (B) mice, scale bar is 1 mm. The first panel displays all detected transcripts across the aortic tissue, with key anatomic landmarks indicated. Subsequent panels depict the colocalization of Myh11 and transcripts of interest. Insets note regions of the ascending aorta and aortic root that are presented at higher magnification.

